
Videos
Starbucks
The first case at the end of this chapter and numerous subsequent chapters is a series of integrative cases involving Starbucks. The series of cases applies the concepts and analytical tools discussed in each chapter to Starbucks’ financial statements and notes. The preparation of responses to the questions in these cases results in an integrated illustration of the six sequential steps in financial statement analysis discussed in this chapter and throughout the book.
Introduction
“They don’t just sell coffee; they sell the Starbucks Experience,” remarked Deb Mills while sitting down to enjoy a cup of Starbucks cappuccino with her friend Kim Shannon. Kim, an investment fund manager for a large insurance firm, reflected on that observation and what it might mean for Starbucks as a potential investment opportunity. Glancing around the store, Kim saw a number of people sitting alone or in groups, lingering over their drinks while chatting, reading, or checking e-mail and surfing the Internet through the store’s wi-fi network. Kim noted that in addition to the wide selection of hot coffees, French and Italian style espressos, teas, and cold coffee-blended drinks, Starbucks also offered food items and baked goods, packages of roasted coffee beans, coffee-related accessories and equipment, and even its own line of CDs. Intrigued, Kim made a mental note to do a full financial statement and valuation analysis of Starbucks to evaluate whether its business model and common equity shares were as good as their coffee.
Growth Strategy
Kim’s research quickly confirmed her friend’s observation that Starbucks is about the experience of enjoying a good cup of coffee. The Starbucks 2012 Form 10-K (page 3) asserts the following:
Our retail objective is to be the leading retailer and brand of coffee in each of our target markets by selling the finest quality coffee and related products, and by providing each customer a unique Starbucks Experience. The Starbucks Experience is built upon superior customer service as well as clean and well-maintained company operated stores that reflect the personalities of the communities in which they operate, thereby building a high degree of customer loyalty.
The Starbucks experience strives to create a “third place”—somewhere besides home and work where a customer can feel comfortable and welcome—through friendly and skilled customer service in clean and personable retail store environments. This approach enabled Starbucks to grow rapidly from just a single store near Pike’s Place Market in Seattle to a global company with 18,066 locations worldwide at the end of fiscal 2012. Of that total, Starbucks owned and operated 9,405 stores (7,857 stores in the Americas; 882 stores in the Europe, Middle East & Africa (EMEA) region; and 666 stores in the China and Asia Pacific (CAP) region). In addition, licensees owned and operated a total of 8,661 stores (5,046 stores in the Americas; 987 stores in the EMEA region; and 2,628 stores in the CAP region).
Most of Starbucks’ stores at the end of fiscal 2012 were located in the United States, amounting to one Starbucks retail location for every 28,000 U.S. residents. However, Starbucks was clearly not a company content to focus simply on the U.S. market, as it was extending the reach of its stores globally, with thousands of stores outside the United States. At the end of fiscal 2012, Starbucks owned and operated stores in a number of countries around the world, including 878 stores in Canada, 593 stores in the United Kingdom, and 408 stores in China.
Starbucks’ success can be attributed in part to its successful development and expansion of a European idea—enjoying a fine coffee-based beverage and sharing that experience with others in a comfortable, friendly environment with pleasant, competent service. Starbucks imported the idea of the French and Italian café into the busy North American lifestyle. Ironically, Starbucks successfully extended its brand and style of a café into the European continent. On January 16, 2004, Starbucks opened its first coffeehouse in France—in the heart of Paris at 26 Avenue de I’Opera—and had a total of 67 stores in France by the end of 2012. The success of Starbucks’ retail coffeehouse concept is illustrated by the fact that by the end of 2012, Star-bucks had opened over 1,100 company-operated and licensed locations in Europe, with the majority of them in the United Kingdom.
Not long ago, Starbucks’ CEO Howard Schultz stated that his vision and ultimate goal for Starbucks was to have 20,000 Starbucks retail locations in the United States, to have another 20,000 retail locations in international markets worldwide, and to have Starbucks recognized among the world’s leading brands. Kim Shannon wondered whether Starbucks could ultimately achieve that level of global penetration because she could name only a few such worldwide companies. Among those that came to mind were McDonald’s, with more than 34,000 retail locations in 118 countries; Subway, with more than 34,000 locations in 90 countries; and Yum! Brands, with more than 40,000 restaurants in 130 countries under brand names such as KFC, Pizza Hut, and Taco Bell.
Growth in the number of retail stores had been one of the primary drivers of Starbucks’ growth in revenues. The most significant area of expansion of the Starbucks model in recent years has been the rapid growth in the number of licensed retail stores. At the end of fiscal 1999, Starbucks had only 363 licensed stores, but by the end of fiscal 2012, the number of licensed stores had mushroomed to 8,661.
Recent Performance
Performance in recent years caused Kim to question whether Starbucks had already reached (or perhaps exceeded) its full potential. She wondered whether it could generate the impressive growth in new stores and revenues that it had created in the past.
In fiscal year 2008, Starbucks opened 1,669 net new retail locations (698 net new company-owned stores and 971 new licensed stores), but this number was well below the initial target of 2,500 new stores and well below the 2,571 new stores opened in 2007. Late in 2008, Starbucks announced a plan to close approximately 600 underperforming stores in the United States as well as 64 underperforming stores in Australia. The store closings triggered restructuring charges that reduced Starbucks’ operating income by $266.9 million in 2008.
During fiscal 2009, they increased the restructuring plan to close a total of approximately 800 U.S. stores (an increase of 200), and managed to close 566 U.S. stores during the year. They also announced a plan to close 100 stores in various international markets. The 2009 store closings triggered additional restructuring charges that reduced Starbucks’ operating income by $332.4 million in 2009. In 2009, for the first time in company history, Starbucks’ net store growth was negative, with a net of 474 stores closed in the United States (92 stores opened net of 566 closed) and only 89 net new international stores opened (130 stores opened net of 41 closed), for a net total closure of 385 company operated stores.
In fiscal 2009, total revenues fell to $9,775 billion from $10,383 billion in fiscal 2008. Fiscal 2009 marked the first year of revenue decline (5.9%) in company history. Prior to 2009, Star-bucks had generated impressive revenue growth rates of 10.3% in fiscal 2008; 20.9% growth in fiscal 2007; and 22.2% in fiscal 2006.
Starbucks’ revenue growth is not just driven by opening new stores; it is also driven by sales growth among existing stores. Through 2007, Starbucks could boast of a streak of 16 consecutive years in which it achieved comparable store sales growth rates equal to or greater than 5%, but that string was broken with negative 3% comparable store sales growth in 2008. Unfortunately, things got worse in 2009, because Starbucks’ company-operated stores generated a negative 6% growth in comparable U.S. store sales, a negative 2% growth in comparable international store sales, and a negative 6% growth in comparable store sales overall.
In response to the downturn in Starbucks’ business, in January, 2009, Howard Schultz returned from retirement and reassumed his role as president and CEO of Starbucks in order to restructure the business and its potential for growth. Focal points of his transformation plan included taking a more disciplined approach to new store openings, reinvigorating the Star-bucks Experience, developing and implementing even better service and quality, while cutting operating and overhead costs. In addition, the transformation plans included introducing more new beverage and food offerings, such as baked goods, breakfast items and chilled and other foods. A key to Starbucks profit growth lies in increasing same store sales growth via new products. Starbucks regularly introduces new specialty coffee-based drinks and coffee flavors, as well as iced coffee-based drinks, such as the very successful line of Frappuccino drinks and Shaken Iced Refreshment drinks.
Under Schultz’s renewed leadership, comparable store sales growth rebounded impressively, to 7% growth among U.S. stores and 6% among international stores. Starbucks’ store openings were very conservative in 2010, owing in part to the difficult economic conditions in the primary markets. In the United States, Starbucks only opened a net 3 new stores in 2010—opening 60 licensed stores while closing 57 company-owned stores. Internationally, Star-bucks opened 220 new stores in 2010—opening 235 licensed stores while closing 15 company-owned stores. Overall revenue growth also rebounded, reaching $10.7 billion (up 9.5% from 2009).
Starbucks continued this modest new store growth trajectory into 2011. Among company-owned stores, Starbucks opened 49 but closed 51 in the United States and opened 180 but closed 36 international stores. Starbucks’ licensees opened 345 new stores internationally and 133 new stores in the United States. Unfortunately, because Borders’ Bookstores went bankrupt in 2011, it closed the 475 Starbucks’ stores that it had licensed. This caused a net negative growth of 342 licensee closings in 2011 in the United States. Overall revenue again sustained healthy growth, with total revenues reaching $11.7 billion (up 9.3% from 2010).
Kim was even more encouraged with Starbucks’ growth in fiscal 2012. During that period, Starbucks opened a total of 1,063 new stores. Of those, Starbucks opened 234 company-owned and 270 licensed stores in the Americas. In the EMEA region, Starbucks opened 10 company-owned and 101 licensed stores, as well as 154 company-owned and 294 licensed stores in the CAP region. Overall revenue reached $13.3 billion (up 14% from 2011).
Starbucks also continues to expand the scope of its business model through new channel development in order to “reach customers where they work, travel, shop, and dine.” To further expand the business model, Starbucks terminated its licensing and distribution agreement with Kraft Foods and now manages its own marketing and distribution of Starbucks whole bean and ground coffee to grocery stores and warehouse club stores. By the end of fiscal 2012, Star-bucks whole bean and ground coffees were available throughout the United States in approximately 39,000 grocery and warehouse club stores. Further, Starbucks sells whole bean and ground coffee through institutional foodservice companies that service business, education, office, hotel, restaurant, airline, and other foodservice accounts. For example, in 2012 Starbucks (and their subsidiary, Seattle’s Best Coffee) were the only superpremium national brand coffees promoted by Sysco Corporation to such foodservice accounts. Finally, Starbucks had formed
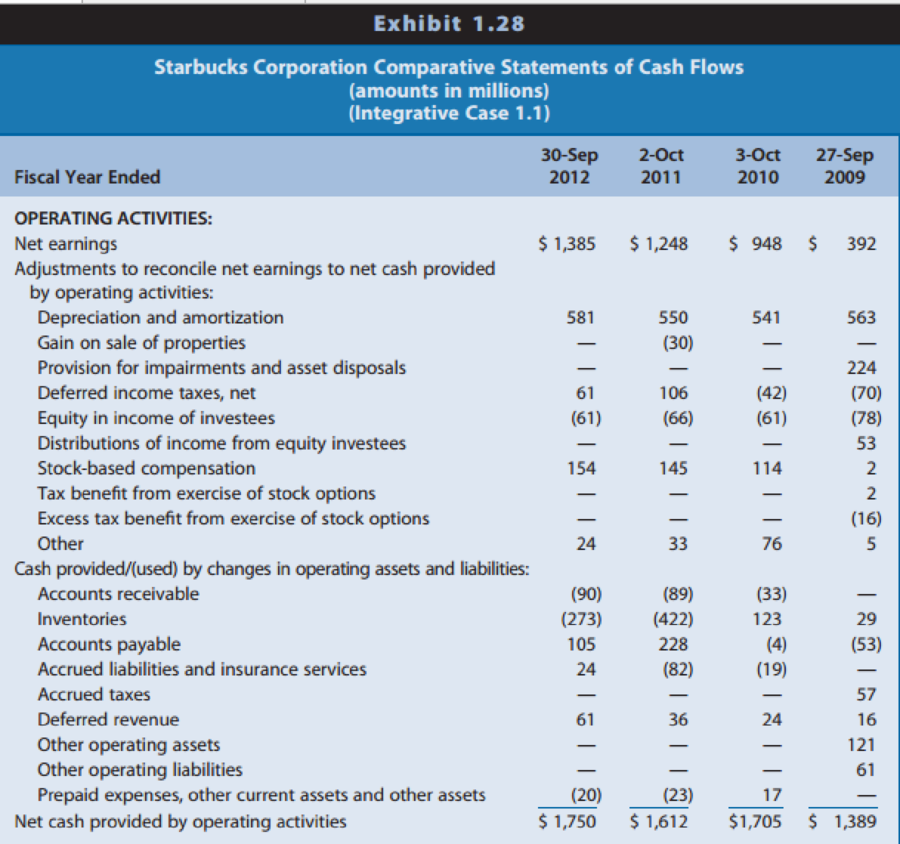
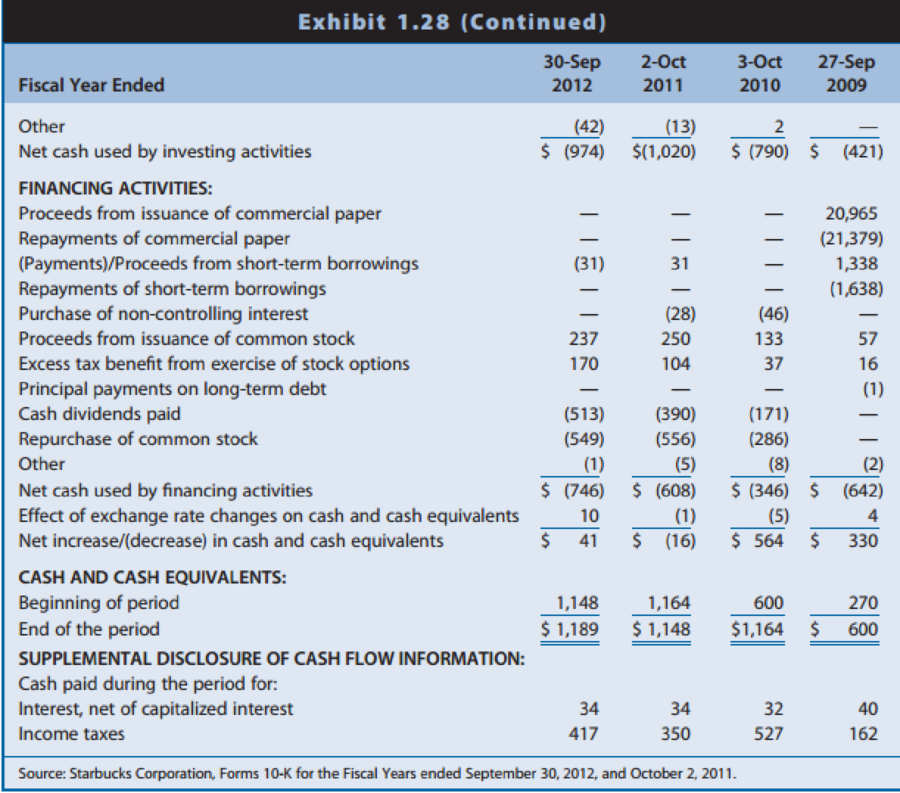
Despite Starbucks’ past difficulties with store closings, restructuring charges, and negative comparable store sales growth rates, Kim could see some very positive aspects of Starbucks’ financial performance and condition. She noted that Starbucks had been profitable in 2008 and 2009, despite the difficulties. She also noted that Starbucks generated record high profits in 2010, 2011, and 2012, suggesting the restructuring and turnaround efforts were proving successful. The restructuring plan was seemingly complete and had helped Starbucks to reduce costs. Further, she noted that Starbucks’ operating cash flows had remained fairly strong throughout this period. With its positive operating cash flows, Starbucks had retired all of the $713 million in commercial paper and short-term borrowings during 2009, initiated the first dividend in company history in 2010, resumed repurchasing common shares in 2010, and had grown the combined balances in cash and short-term investments over $2.0 billion by fiscal year-end 2012.
Product Supply
Starbucks purchases green coffee beans from coffee-producing regions around the world and custom roasts and blends them to its exacting standards. Although coffee beans trade in commodity markets and experience volatile prices, Starbucks purchases higher-quality coffee beans that sell at a premium to commodity coffees. Starbucks purchases its coffee beans under fixed-price purchase contracts with various suppliers, with purchase prices reset annually. Starbucks also purchases significant amounts of dairy products from suppliers located near its retail stores. Starbucks purchases paper and plastic products from several suppliers, the prices of which vary with changes in the prices of commodity paper and plastic resin.
Competition in the Specialty Coffee Industry
After some reflection, Kim realized that Starbucks faced intense direct competition. Kim could think of a wide array of convenient retail locations where a person can purchase a cup of coffee. Kim reasoned that Starbucks competes with a broad scope of coffee beverage retailers, including fast-food chains (for example, McDonald’s), doughnut chains (for example, Krispy Kreme, Dunkin’ Donuts, and Tim Hortons), and convenience stores associated with many gas stations, but that these types of outlets offer an experience that is very different from what Starbucks offers. In particular, Kim was aware that McDonald's had started to expand development of its McCafé shops, which sold premium coffee drinks (lattes, cappuccinos, and mochas) in McDonald’s restaurants. It appeared to Kim that the McCafé initiative was intended to be a direct competitive challenge to Starbucks’ business.
Kim also identified a number of companies that were growing chains of retail coffee shops that could be compared to Starbucks, including firms such as Panera Bread Company; Diedrich Coffee; New World Restaurant Group, Inc.; and Caribou Coffee Company, Inc. (a privately held firm). However, these firms were much smaller than Starbucks, with the largest among them being the Panera Bread Company, with approximately 1,700 bakery-cafés system-wide at the end of 2012. On the other end of the spectrum, Kim was aware that Starbucks faced competition from local independent coffee shops and cafés.
Kim recognized that despite facing extensive competition, Starbucks had some distinct competitive advantages. Very few companies were implementing a business strategy comparable to that of Starbucks, with emphasis on the quality of the experience, the products, and the service. In addition, only the fast-food chains and the doughnut chains operated on the same scale as Starbucks. Finally, Starbucks had developed a global brand that was synonymous with the quality of the Starbucks experience. Recently, Interbrand ranked the Starbucks brand as one of the world’s top 100 most valuable brand names, estimating it to be worth in excess of $4 billion.
The Valuation Controversy
In beginning to research Starbucks’ share price (ticker: SBUX), Kim realized that it had experienced a wild ride over the past five years, following a very similar pattern to Starbucks’ earnings performance during that time. Starbucks had been one of the hottest companies in the capital market, in large part due to its impressive growth in sales and earnings, up until December of 2006. SBUX’s share price had appreciated dramatically, generating cumulative returns that far exceeded those of the S&P 500 over that period. The market for Starbucks’ shares cooled beginning in early 2007, with share prices falling from a high of nearly $40 to a low of under $8 in November of 2008. Since that low point, Starbucks’ share price began a dramatic recovery. Over the calendar year 2012, SBUX stock price ranged between $42 and $62 per share, and was currently trading at $50 per share, implying a PE ratio of over 28 (based on trailing 12 months earnings per share of $1.79), an earnings multiple that is well above the industry average.
Kim further discovered that the capital markets and analysts have mixed opinions on the SBUX stock value. Kim found one-year-ahead price targets from 24 analysts, ranging from a low of $49 to a high of $65, with a mean (median) price target of $59 ($60). She found that 30 analysts issued investment recommendations for SBUX: eleven recommend strong buy, ten recommend buy, nine recommend hold, and no analysts recommend sell. The consensus analysts’ earnings per share
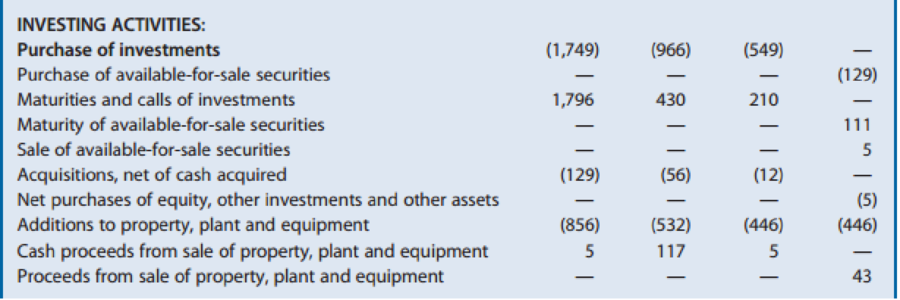
Financial Statements
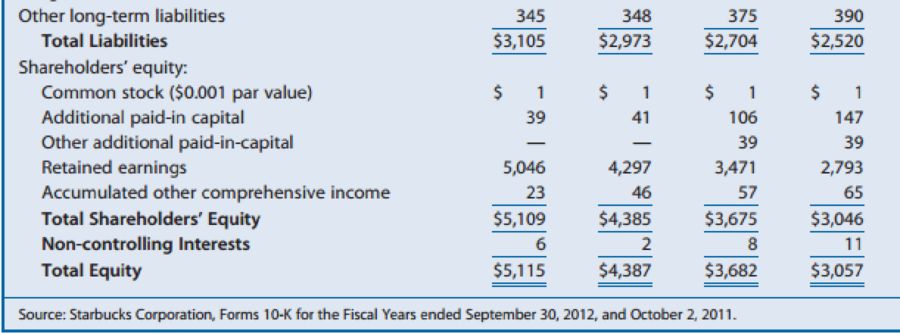
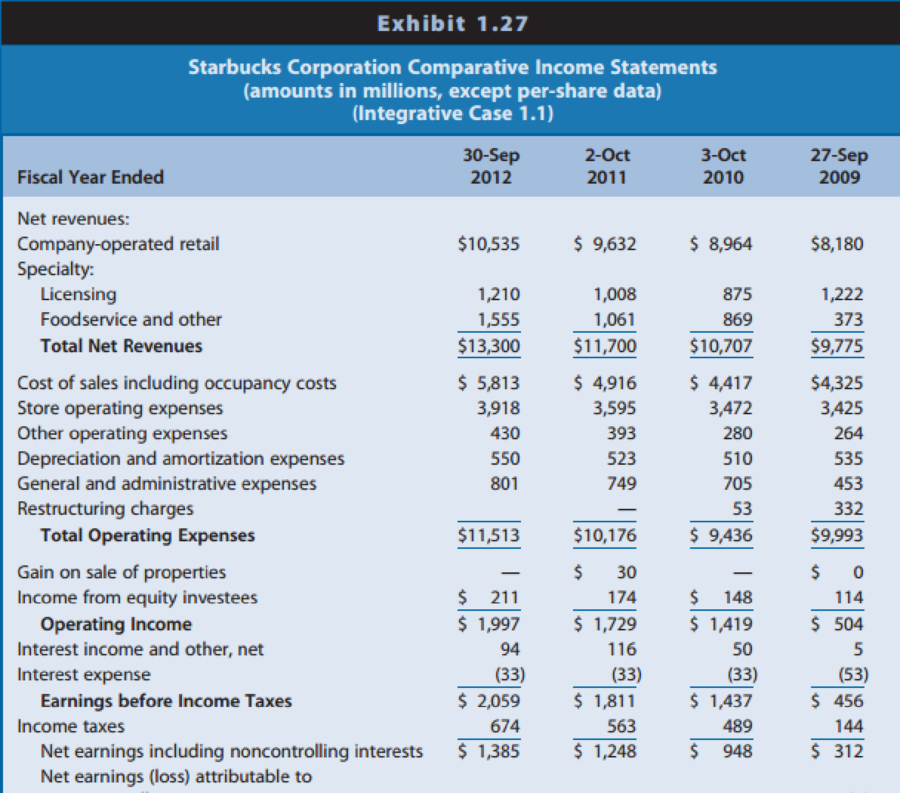
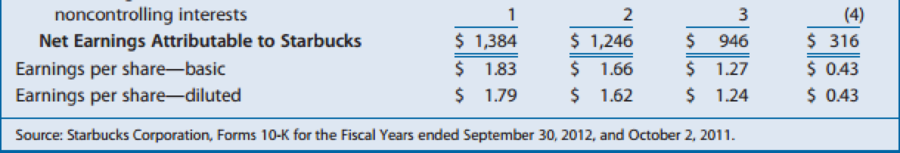
Exhibit 126 presents comparative
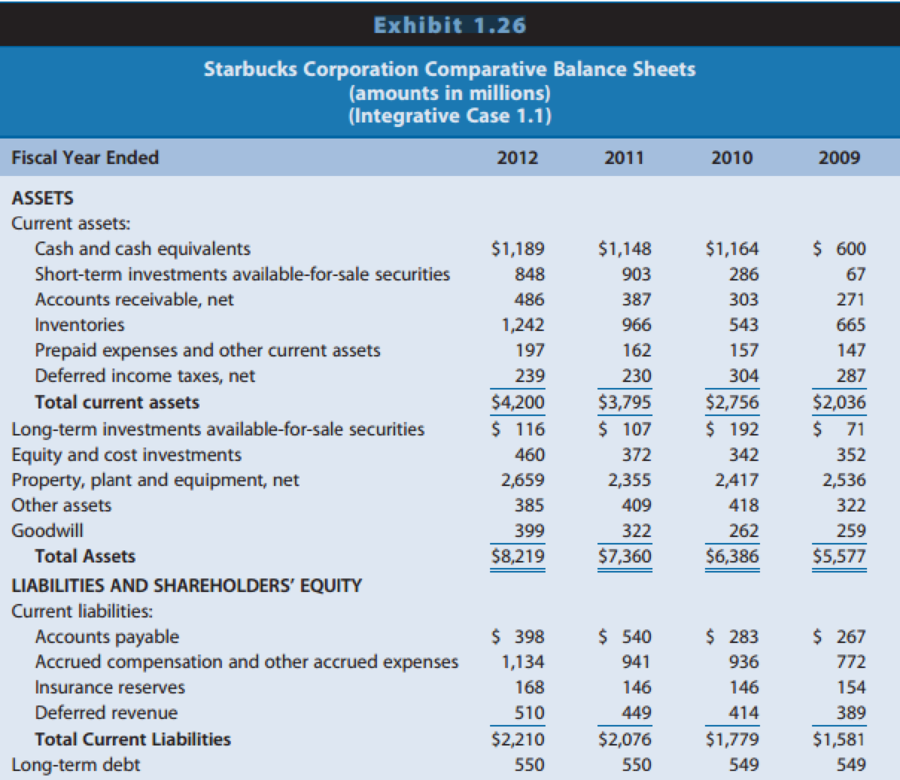
Accounts receivable are reported net of allowance for uncollectible accounts. Why? Identify the events or transactions that cause accounts receivable to increases and decrease. Also identify the events or transactions that cause the allowance account to increase and decrease.
Want to see the full answer?
Check out a sample textbook solution
Chapter 1 Solutions
Financial Reporting, Financial Statement Analysis and Valuation


- Light Sweet Petroleum, Inc., is trying to evaluate a generation project with the following cash flows. If the company requires a return of 12 percent on its investments, what is the project's NPV? What are the IRRS for the project? Year 0 $ (45,000,000) Year 1 $ 71,000,000 Year 2 $ (15,000,000) Required return 12% Complete the following analysis. Do not hard code values in your calculations. Use a "Guess" of .99 to calculate the higher IRR and -.99 to calculate the lower IRR. You must use the built-in Excel functions to answer this question. NPV Higher IRR Lower IRRarrow_forwardBethesda Mining Company reports the following balance sheet information for 2021 and 2022: Assets Current assets 2021 BETHESDA MINING COMPANY Balance Sheets as of December 31, 2021 and 2022 Liabilities and Owners' Equity Current liabilities Accounts payable Notes payable 2021 $ 190,422 85,520 2022 Cash Accounts receivable Inventory $ 47,858 61,781 124,912 $ 60,783 82,139 190,747 Total $ 275,942 Total $ 234,551 $ 333,669 Long-term debt $ 238,000 Owners' equity Fixed assets Common stock and paid-in surplus Accumulated retained earnings $ 217,000 161,656 Net plant and equipment Total assets $ 658,047 $ 589,628 $ 378,656 $ 892,598 $ 923,297 Total liabilities and owners' equity $ 892,598 Total 2022 $ 198,111 137,088 $ 335,199 $ 174,750 $ 217,000 196,348 $ 413,348 $ 923,297 Based on the balance sheets given, calculate the following financial ratios for each year: Calculate the following financial ratios for each year: a. Current ratio. Note: Do not round intermediate calculations and round…arrow_forwardMary decides to buy a Treasury note futures contract for delivery of $100,000 face amount in September, at a price of 120′24.0. At the same time, Eric decides to sell a Treasury note futures contract if he can get a price of 120′24.0 or higher. The exchange, in turn, agrees to sell one Treasury note contract to Mary at 120′24.0 and to buy one contract from Eric at 120′24.0. The price of the Treasury note decreases to 120′10.5. Calculate Eric's balance on margin account. Assume that initial margin is $1,890. Please note that loss should be entered with minus sign. Round the answer to two decimal places.arrow_forward
- Don't used hand raiting and don't used Ai solutionarrow_forward(2x76m A = + S) Waterfront Inc. wishes to borrow on a short-term basis without reducing its current ratio below 1.25. At present its current assets and current liabilities are $1,600 and $1,000 respectively. How much can Waterfront Inc. borrow?arrow_forwardExpected Standard Stock Return Beta Deviation A B 12% 16 0.75 1.25 28% 37 The market index has a standard deviation of 22% and the risk-free rate is 9%. Required: a. What are the standard deviations of stocks A and B? b. Suppose that we were to construct a portfolio with proportions: Stock A Stock B T-bills 0.25 0.50 0.25 Compute the expected return, beta, nonsystematic standard deviation, and standard deviation of the portfolio. Complete this question by entering your answers in the tabs below. Required A Required B What are the standard deviations of stocks A and B? Note: Do not round intermediate calculations. Round your answers to 2 decimal places. Stock A 0.33 % Stock B 0.46 %arrow_forward
- Don't used hand raiting and don't used Ai solutionarrow_forwardCould you explain what are the Biblical principles researchers that can follow to mitigate researcher bias? How to use of Biblical ethics to synthesize the literature to avoid misrepresentation of the literature? How researchers can demonstrate Biblical ethics when collecting and analyzing data?arrow_forwardThe manager of company A is thinking about adding an air conditioner to the office. The AC will cost $1630 to buy and install. The manager plans to use the AC for 5 years and each year's depreciation rate is 18% of the purchase price. The manager expects to sell the AC in 5 years for $880.The tax rate is 15% and the company's WACC is 15%. If the manager considers this purchase of AC as an investment, what is the NPV (keep two decimal places and assume that the AC will not affect the operations of the company)?arrow_forward
- Problem 5-5 Calculating IRR A firm has a project with the following cash flows: Year Cash Flow 0 -$27,700 1 23 11,700 14,700 10,700 The appropriate discount rate is 18 percent. What is the IRR for this project? (Do not round intermediate calculations and enter your answer as a percent rounded to 2 decimal places, e.g., 32.16.) IRR %arrow_forwardCould you help to explain: How researchers can demonstrate Biblical ethics when conducting a literature review? How researchers can demonstrate Biblical ethics when communicating with a research team or university committee? How researchers can demonstrate Biblical ethics when recruiting participants. Provide Biblical and/or scholarly support for all assertions?arrow_forwardCould you please help explain what is the Biblical ethics in research? How do they establish a firm ethical foundation based on Biblical principles? What should they do to reduce the researcher bias as well as misrepresenting the literature and study findings? How Christians would like to ensure of being obedient to God in the research and study conduct?arrow_forward
 Financial Reporting, Financial Statement Analysis...FinanceISBN:9781285190907Author:James M. Wahlen, Stephen P. Baginski, Mark BradshawPublisher:Cengage Learning
 Intermediate Accounting: Reporting And AnalysisAccountingISBN:9781337788281Author:James M. Wahlen, Jefferson P. Jones, Donald PagachPublisher:Cengage Learning
 Financial Accounting: The Impact on Decision Make...AccountingISBN:9781305654174Author:Gary A. Porter, Curtis L. NortonPublisher:Cengage Learning
 Principles of Accounting Volume 2AccountingISBN:9781947172609Author:OpenStaxPublisher:OpenStax College
 Financial And Managerial AccountingAccountingISBN:9781337902663Author:WARREN, Carl S.Publisher:Cengage Learning,
 Fundamentals of Financial Management, Concise Edi...FinanceISBN:9781305635937Author:Eugene F. Brigham, Joel F. HoustonPublisher:Cengage Learning