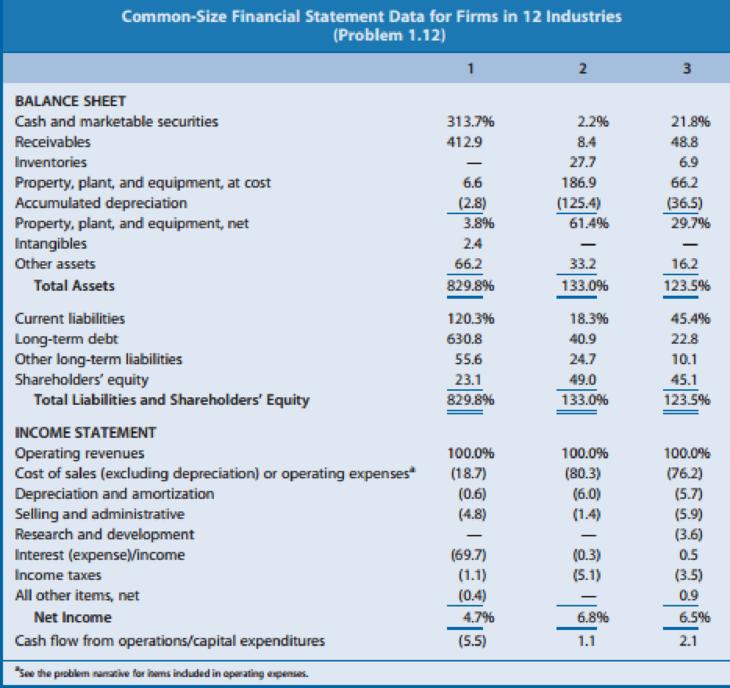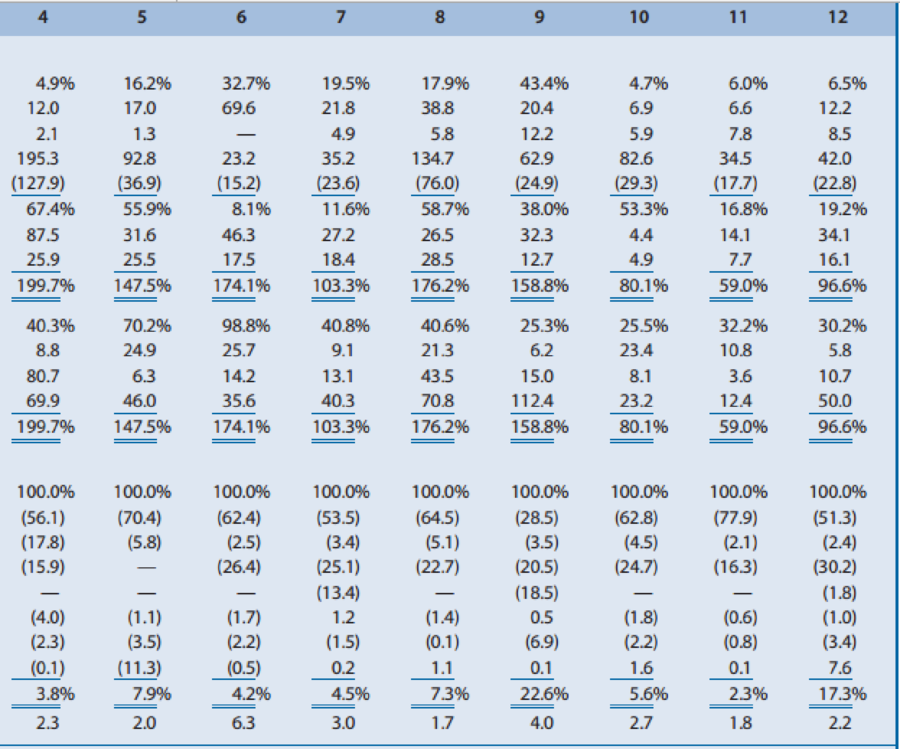
Value Chain Analysis and Financial Statement Relations. Exhibit 1.25 (page 68) presents common-size income statements and
- A. Wyeth: Engages in the development, manufacture, and sale of ethical drugs (that is, drugs requiring a prescription). Wyeth’s drugs represent primarily mixtures of chemical compounds. Ethical-drug companies must obtain approval of new drugs from the U.S. Food and Drug Administration (FDA). Patents protect such drugs from competition until other drug companies develop more effective substitutes or the patent expires.
- B. Amgen: Engages in the development, manufacture, and sale of drugs based on biotechnology research. Biotechnology drugs must obtain approval from the FDA and enjoy patent protection similar to that for chemical-based drugs. The biotechnology segment is less mature than the ethical-drug industry, with relatively few products having received FDA approval.
- C. Mylan Laboratories: Engages in the development, manufacture, and sale of generic drugs. Generic drugs have the same chemical compositions as drugs that had previously benefited from patent protection but for which the patent has expired. Generic-drug companies have benefited in recent years from the patent expiration of several major ethical drugs. However, the major ethical-drug companies have increasingly offered generic versions of their ethical drugs to compete against the generic-drug companies.
- D. Johnson & Johnson: Engages in the development, manufacture, and sale of over-thecounter health care products. Such products do not require a prescription and often benefit from brand recognition.
- E. Covance: Offers product development and laboratory testing services for biotechnology and pharmaceutical drugs. It also offers commercialization
services and market access services. Cost of goods sold for this company represents the salaries of personnel conducting the laboratory testing and drug approval services. - F. Cardinal Health: Distributes drugs as a wholesaler to drugstores, hospitals, and mass erchandisers. Also offers pharmaceutical benefit management services in which it provides customized databases designed to help customers order more efficiently, contain costs, and monitor their purchases. Cost of goods sold for Cardinal Health includes the cost of drugs sold plus the salaries of personnel providing pharmaceutical benefit management services.
- G. Walgreens: Operates a chain of drugstores nationwide. The data in Exhibit 1.25 for Walgreens include the recognition of operating lease commitments for retail space.
REQUIRED
Use the ratios to match the companies in Exhibit 1.25 with the firms listed above.


Trending nowThis is a popular solution!

Chapter 1 Solutions
Financial Reporting, Financial Statement Analysis and Valuation
- If data is unclear or blurr then comment i will write it. please don't use AI i will unhelpfularrow_forwardYou are considering an option to purchase or rent a single residential property. You can rent it for $5,000 per month and the owner would be responsible for maintenance, property insurance, and property taxes. Alternatively, you can purchase this property for $204,500 and finance it with an 80 percent mortgage loan at 4 percent interest that will fully amortize over a 30-year period. The loan can be prepaid at any time with no penalty. You have done research in the market area and found that (1) properties have historically appreciated at an annual rate of 2 percent per year, and rents on similar properties have also increased at 2 percent annually; (2) maintenance and insurance are currently $1,545.00 each per year and they have been increasing at a rate of 3 percent per year; (3) you are in a 24 percent marginal tax rate and plan to occupy the property as your principal residence for at least four years; (4) the capital gains exclusion would apply when you sell the property; (5)…arrow_forwardIf data is unclear or blurr then comment i will write it.arrow_forward
- I need answer typing clear urjent no chatgpt used pls i will give 5 Upvotes.arrow_forwardcorrect an If image is blurr or data is unclear then plz comment i will write values or upload a new image. i will give unhelpful if you will use incorrect data.arrow_forwardWhat are the five management assertions that serve as basis for financial statements audit programs?arrow_forward
- PROBLEM 2 On July 1, 2022, LTU Contracting, Inc. purchased a new Peiner SK575 Tower Crane for a total cost of $875,000. The crane has an estimated useful life of five (5) years. For financial reporting (book) purposes, the company utilizes straight line depreciation. For tax purposes, the equipment is depreciated over five years utilizing the 200% declining balance method. A. Prepare a table that computes the book and tax depreciation for each year of the useful life and determine the difference in book value between each method at the end of each year. B. On July 1st, 2025, the company is considering selling the crane for $500,000. Compute what the gain or loss would have been at that time for both book and tax purposes.arrow_forwardBrightwoodę Furniture provides the following financial data for a given enod: Sales Aount ($) Per Unit ($) 150,000 13 Less Variable E - L96,000 13 Contribwaon Margin c 1C Less Fixed Expenses $5,000 et Income 125,000 a. What is the company's CM ratio? b. If quarterly sales increase by $5,200 and there is no change in fixed expenses, by how much would you expect quarterly net operating income to increase?arrow_forwardPlease give correct answer dont use chatgpt . if image is blurr or any data is unclear then please comment i will write values , dont give answer without sure that data in image is showing properly.arrow_forward
 Financial Reporting, Financial Statement Analysis...FinanceISBN:9781285190907Author:James M. Wahlen, Stephen P. Baginski, Mark BradshawPublisher:Cengage Learning

