
Intro Stats
4th Edition
ISBN: 9780321826275
Author: Richard D. De Veaux
Publisher: PEARSON
expand_more
expand_more
format_list_bulleted
Concept explainers
Videos
Textbook Question
Chapter R, Problem 6.29RE
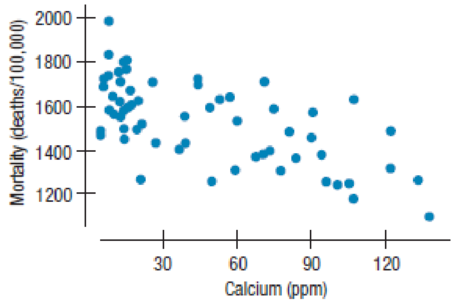
Hard water In an investigation of environmental causes of disease, data were collected on the annual mortality rate (deaths per 100,000) for males in 61 large towns in England and Wales. In addition, the water hardness was recorded as the calcium concentration (parts per million, or ppm) in the drinking water. Here are the
Dependent variable is Mortality
R-squared = 43%
s = 143.0 with 61 - 2 = 59 degrees of freedom
| Variable | Coefficient | SE(Coeff) |
| Intercept | 1676 | 29.30 |
| Calcium | –3.23 | 0.48 |
- a) Is there an association between the hardness of the water and the mortality rate? Write the appropriate hypothesis.
- b) Assuming the assumptions for regression inference are met, what do you conclude?
- c) Create a 95% confidence interval for the slope of the true line relating calcium concentration and mortality.
- d) Interpret your interval in context.
Expert Solution & Answer
Want to see the full answer?
Check out a sample textbook solution
Students have asked these similar questions
if the b coloumn of a z table disappeared what would be used to determine b column probabilities
Construct a model of population flow between metropolitan and nonmetropolitan areas of a given country, given that their respective populations in 2015 were 263 million and 45 million. The probabilities
are given by the following matrix.
(from)
(to)
metro nonmetro
0.99 0.02 metro
0.01 0.98
nonmetro
Predict the population distributions of metropolitan and nonmetropolitan areas for the years 2016 through 2020 (in millions, to four decimal places). (Let x, through x5 represent the years 2016 through
2020, respectively.)
x₁ =
x2
X3
261.27
46.73
11
259.59
48.41
11
257.96
50.04
11
256.39
51.61
11
t
If the average price of a new one family home is $246,300 with a standard deviation of $15,000 find the minimum and maximum prices of the houses that a contractor will build to satisfy 88% of the market value
Chapter R Solutions
Intro Stats
Ch. R - Bananas Here are the prices (in cents per pound)...Ch. R - Prob. 1.2RECh. R - Prob. 1.3RECh. R - Dialysis In a study of dialysis, researchers found...Ch. R - Beanstalks Beanstalk Clubs are social clubs for...Ch. R - Bread Clarksburg Bakery is trying to predict how...Ch. R - State University Public relations staff members at...Ch. R - Prob. 1.8RECh. R - Prob. 1.9RECh. R - Streams As part of the course work, a class at an...
Ch. R - Prob. 1.11RECh. R - Prob. 1.12RECh. R - Lets play cards You pick a card from a standard...Ch. R - Accidents Progressive Insurance asked customers...Ch. R - Hard water In an investigation of environmental...Ch. R - Prob. 1.16RECh. R - Seasons Average daily temperatures in January and...Ch. R - Prob. 1.18RECh. R - Prob. 1.19RECh. R - Prob. 1.20RECh. R - Libertys nose Is the Statue of Libertys nose too...Ch. R - Winter Olympics 2010 speed skating The times from...Ch. R - Sample A study in South Africa focusing on the...Ch. R - Sluggers Babe Ruth was the first great slugger in...Ch. R - Prob. 1.25RECh. R - Music and memory Is it a good idea to listen to...Ch. R - Mail Here are the number of pieces of mail...Ch. R - Birth order Is your birth order related to your...Ch. R - Herbal medicine Researchers for the Herbal...Ch. R - Birth order revisited Consider again the data on...Ch. R - Engines One measure of the size of an automobile...Ch. R - Engines, again Horsepower is another measure...Ch. R - Prob. 1.33RECh. R - Prob. 1.34RECh. R - Age and party 2011 II Consider again the Pew...Ch. R - Prob. 1.36RECh. R - Prob. 1.37RECh. R - Prob. 1.38RECh. R - Matching Here are several scatterplots. The...Ch. R - Prob. 2.2RECh. R - Prob. 2.3RECh. R - Vineyards again Instead of Age, perhaps the Size...Ch. R - Prob. 2.5RECh. R - Prob. 2.6RECh. R - Prob. 2.7RECh. R - Prob. 2.8RECh. R - 9. A manatee model 2010 Continue your analysis of...Ch. R - Prob. 2.10RECh. R - Prob. 2.11RECh. R - Traffic Highway planners investigated the...Ch. R - Prob. 2.13RECh. R - Cars, correlations What factor most explains...Ch. R - Cars, horsepower Can we predict the Horsepower of...Ch. R - Prob. 2.16RECh. R - Prob. 2.17RECh. R - Prob. 2.18RECh. R - How old is that tree? One can determine how old a...Ch. R - Prob. 2.20RECh. R - Prob. 2.21RECh. R - 22. Smoking and pregnancy 2006 The Child Trends...Ch. R - Prob. 2.23RECh. R - Prob. 2.24RECh. R - Prob. 2.25RECh. R - Prob. 2.26RECh. R - Prob. 2.27RECh. R - Depression The September 1998 issue of the...Ch. R - 29. Jumps 2008 How are Olympic performances in...Ch. R - Prob. 2.30RECh. R - French Consider the association between a students...Ch. R - Prob. 2.32RECh. R - Prob. 2.33RECh. R - Gasoline Since clean-air regulations have dictated...Ch. R - Prob. 2.35RECh. R - Prob. 2.36RECh. R - Prob. 2.37RECh. R - Prob. 2.38RECh. R - Prob. 2.39RECh. R - Prob. 2.40RECh. R - Prob. 2.41RECh. R - Prob. 2.42RECh. R - R3.1R3.18. What design? Analyze the design of each...Ch. R - R3.1R3.18. What design? Analyze the design of each...Ch. R - Prob. 3.3RECh. R - Prob. 3.4RECh. R - R3.1R3.18. What design? Analyze the design of each...Ch. R - Prob. 3.6RECh. R - R3.1R3.18. What design? Analyze the design of each...Ch. R - R3.1R3.18. What design? Analyze the design of each...Ch. R - R3.1R3.18. What design? Analyze the design of each...Ch. R - R3.1R3.18. What design? Analyze the design of each...Ch. R - Prob. 3.11RECh. R - An artisan wants to create pottery that has the...Ch. R - Prob. 3.13RECh. R - R3.1R3.18. What design? Analyze the design of each...Ch. R - R3.1R3.18. What design? Analyze the design of each...Ch. R - R3.1R3.18. What design? Analyze the design of each...Ch. R - R3.1R3.18. What design? Analyze the design of each...Ch. R - R3.1R3.18. What design? Analyze the design of each...Ch. R - Prob. 3.19RECh. R - Prob. 3.20RECh. R - Prob. 3.21RECh. R - Cell phone risks Researchers at the Washington...Ch. R - Prob. 3.23RECh. R - Prob. 3.24RECh. R - Prob. 3.25RECh. R - Prob. 3.27RECh. R - Prob. 3.28RECh. R - Homecoming A college statistics class conducted a...Ch. R - Youthful appearance Readers Digest (April 2002, p....Ch. R - Smoking and Alzheimers Medical studies indicate...Ch. R - Prob. 3.32RECh. R - Sex and violence Does the content of a television...Ch. R - Pubs In England, a Leeds University researcher...Ch. R - Age and party 2008 The Pew Research Center...Ch. R - Bias? Political analyst Michael Barone has written...Ch. R - Prob. 3.37RECh. R - Acupuncture Research reported in 2008 brings to...Ch. R - 40. NBA draft lottery Professional basketball...Ch. R - Security There are 20 first-class passengers and...Ch. R - Prob. 3.42RECh. R - Prob. 3.43RECh. R - Prob. 4.1RECh. R - Prob. 4.2RECh. R - Prob. 4.3RECh. R - Prob. 4.4RECh. R - Prob. 4.5RECh. R - Emergency switch Safety engineers must determine...Ch. R - Prob. 4.7RECh. R - Prob. 4.8RECh. R - Prob. 4.9RECh. R - Prob. 4.10RECh. R - Prob. 4.11RECh. R - Prob. 4.12RECh. R - Prob. 4.13RECh. R - Prob. 4.14RECh. R - Prob. 4.15RECh. R - Prob. 4.16RECh. R - Prob. 4.17RECh. R - Prob. 4.18RECh. R - Prob. 4.19RECh. R - Prob. 4.20RECh. R - Prob. 4.21RECh. R - Prob. 4.22RECh. R - Prob. 4.23RECh. R - Prob. 4.24RECh. R - Prob. 4.25RECh. R - Prob. 4.26RECh. R - Prob. 4.27RECh. R - Prob. 4.28RECh. R - Prob. 4.29RECh. R - Prob. 4.30RECh. R - Prob. 4.31RECh. R - Prob. 4.32RECh. R - Prob. 4.33RECh. R - Prob. 4.34RECh. R - Prob. 4.35RECh. R - Prob. 4.36RECh. R - Prob. 4.37RECh. R - Prob. 4.38RECh. R - Prob. 4.39RECh. R - 40. Coins A coin is to be tossed 36 times.
a) What...Ch. R - Prob. 4.41RECh. R - Prob. 4.42RECh. R - Pregnant? Suppose that 70% of the women who...Ch. R - Prob. 4.44RECh. R - Prob. 5.1RECh. R - Color-blind Medical literature says that about 8%...Ch. R - Hamsters How large are hamster litters? Among 47...Ch. R - 4. Polling 2004 The 2004 U.S. presidential...Ch. R - 5. Leaky gas tanks Nationwide, it is estimated...Ch. R - Prob. 5.6RECh. R - Scrabble Using a computer to play many simulated...Ch. R - Prob. 5.8RECh. R - Prob. 5.9RECh. R - 10. Gay marriage In May 2012, a CNN/ORC Poll asked...Ch. R - Prob. 5.11RECh. R - Prob. 5.12RECh. R - Archery A champion archer can generally hit the...Ch. R - 14. Eggs The ISA Babcock Company supplies poultry...Ch. R - Prob. 5.15RECh. R - Prob. 5.16RECh. R - Prob. 5.17RECh. R - Largemouth bass Organizers of a fishing tournament...Ch. R - Prob. 5.19RECh. R - Language Neurological research has shown that in...Ch. R - Prob. 5.21RECh. R - Prob. 5.22RECh. R - Prob. 5.23RECh. R - Prob. 5.24RECh. R - 25. Errors An auto parts company advertises that...Ch. R - Safety Observers in Texas watched children at play...Ch. R - Prob. 5.27RECh. R - Prob. 5.28RECh. R - Prob. 5.29RECh. R - Grade inflation In 1996, 20% of all students at a...Ch. R - Prob. 5.31RECh. R - Prob. 5.32RECh. R - Prob. 5.33RECh. R - Prob. 5.34RECh. R - Prob. 5.35RECh. R - Prob. 5.36RECh. R - Prob. 5.37RECh. R - Prob. 5.38RECh. R - Streams Researchers in the Adirondack Mountains...Ch. R - Skin cancer In February 2012, MedPage Today...Ch. R - Bread Clarksburg Bakery is trying to predict how...Ch. R - Prob. 5.42RECh. R - Prob. 5.43RECh. R - Batteries We work for the Watchdog for the...Ch. R - Prob. 6.1RECh. R - Prob. 6.2RECh. R - Prob. 6.3RECh. R - Prob. 6.4RECh. R - Prob. 6.5RECh. R - Prob. 6.6RECh. R - Prob. 6.7RECh. R - Prob. 6.8RECh. R - Prob. 6.9RECh. R - Preemies Among 242 Cleveland-area children born...Ch. R - Crawling A study found that babies born at...Ch. R - Mazes and smells Can pleasant smells improve...Ch. R - Pottery Archaeologists can use the chemical...Ch. R - Grant writing Does race matter when applying for...Ch. R - Feeding fish In the midwestern United States, a...Ch. R - Prob. 6.16RECh. R - Age In a study of how depression may affect ones...Ch. R - Prob. 6.18RECh. R - Eating disorders A study conducted in the...Ch. R - Cesareans Some people fear that differences in...Ch. R - Prob. 6.21RECh. R - Prob. 6.22RECh. R - Teach for America, part II The study described in...Ch. R - Prob. 6.24RECh. R - Prob. 6.25RECh. R - Prob. 6.26RECh. R - Genetics Two human traits controlled by a single...Ch. R - Prob. 6.28RECh. R - Hard water In an investigation of environmental...Ch. R - Prob. 6.30RECh. R - Prob. 6.31RECh. R - Prob. 6.32RECh. R - 33. AP Statistics scores 2010 In 2010, almost...Ch. R - Prob. 6.34RECh. R - Prob. 6.35RECh. R - Prob. 6.36RECh. R - Prob. 6.37RECh. R - Eye and hair color A survey of 1021 school-age...Ch. R - Prob. 6.39RECh. R - Prob. 6.40RECh. R - Prob. 6.41RECh. R - Prob. 6.42RECh. R - Prob. 6.43RECh. R - Learning math Developers of a new math curriculum...Ch. R - Prob. 6.45RECh. R - Dairy sales Peninsula Creameries sells both...Ch. R - Prob. 6.47RECh. R - Prob. 6.48RECh. R - Diet Thirteen overweight women volunteered for a...Ch. R - Cramming Students in two basic Spanish classes...Ch. R - Prob. 6.51RECh. R - Newspapers Who reads the newspaper more, men or...
Knowledge Booster


Learn more about
Need a deep-dive on the concept behind this application? Look no further. Learn more about this topic, statistics and related others by exploring similar questions and additional content below.Similar questions
- 21. ANALYSIS OF LAST DIGITS Heights of statistics students were obtained by the author as part of an experiment conducted for class. The last digits of those heights are listed below. Construct a frequency distribution with 10 classes. Based on the distribution, do the heights appear to be reported or actually measured? Does there appear to be a gap in the frequencies and, if so, how might that gap be explained? What do you know about the accuracy of the results? 3 4 555 0 0 0 0 0 0 0 0 0 1 1 23 3 5 5 5 5 5 5 5 5 5 5 5 5 6 6 8 8 8 9arrow_forwardA side view of a recycling bin lid is diagramed below where two panels come together at a right angle. 45 in 24 in Width? — Given this information, how wide is the recycling bin in inches?arrow_forward1 No. 2 3 4 Binomial Prob. X n P Answer 5 6 4 7 8 9 10 12345678 8 3 4 2 2552 10 0.7 0.233 0.3 0.132 7 0.6 0.290 20 0.02 0.053 150 1000 0.15 0.035 8 7 10 0.7 0.383 11 9 3 5 0.3 0.132 12 10 4 7 0.6 0.290 13 Poisson Probability 14 X lambda Answer 18 4 19 20 21 22 23 9 15 16 17 3 1234567829 3 2 0.180 2 1.5 0.251 12 10 0.095 5 3 0.101 7 4 0.060 3 2 0.180 2 1.5 0.251 24 10 12 10 0.095arrow_forward
- step by step on Microssoft on how to put this in excel and the answers please Find binomial probability if: x = 8, n = 10, p = 0.7 x= 3, n=5, p = 0.3 x = 4, n=7, p = 0.6 Quality Control: A factory produces light bulbs with a 2% defect rate. If a random sample of 20 bulbs is tested, what is the probability that exactly 2 bulbs are defective? (hint: p=2% or 0.02; x =2, n=20; use the same logic for the following problems) Marketing Campaign: A marketing company sends out 1,000 promotional emails. The probability of any email being opened is 0.15. What is the probability that exactly 150 emails will be opened? (hint: total emails or n=1000, x =150) Customer Satisfaction: A survey shows that 70% of customers are satisfied with a new product. Out of 10 randomly selected customers, what is the probability that at least 8 are satisfied? (hint: One of the keyword in this question is “at least 8”, it is not “exactly 8”, the correct formula for this should be = 1- (binom.dist(7, 10, 0.7,…arrow_forwardKate, Luke, Mary and Nancy are sharing a cake. The cake had previously been divided into four slices (s1, s2, s3 and s4). What is an example of fair division of the cake S1 S2 S3 S4 Kate $4.00 $6.00 $6.00 $4.00 Luke $5.30 $5.00 $5.25 $5.45 Mary $4.25 $4.50 $3.50 $3.75 Nancy $6.00 $4.00 $4.00 $6.00arrow_forwardFaye cuts the sandwich in two fair shares to her. What is the first half s1arrow_forward
- Question 2. An American option on a stock has payoff given by F = f(St) when it is exercised at time t. We know that the function f is convex. A person claims that because of convexity, it is optimal to exercise at expiration T. Do you agree with them?arrow_forwardQuestion 4. We consider a CRR model with So == 5 and up and down factors u = 1.03 and d = 0.96. We consider the interest rate r = 4% (over one period). Is this a suitable CRR model? (Explain your answer.)arrow_forwardQuestion 3. We want to price a put option with strike price K and expiration T. Two financial advisors estimate the parameters with two different statistical methods: they obtain the same return rate μ, the same volatility σ, but the first advisor has interest r₁ and the second advisor has interest rate r2 (r1>r2). They both use a CRR model with the same number of periods to price the option. Which advisor will get the larger price? (Explain your answer.)arrow_forward
- Question 5. We consider a put option with strike price K and expiration T. This option is priced using a 1-period CRR model. We consider r > 0, and σ > 0 very large. What is the approximate price of the option? In other words, what is the limit of the price of the option as σ∞. (Briefly justify your answer.)arrow_forwardQuestion 6. You collect daily data for the stock of a company Z over the past 4 months (i.e. 80 days) and calculate the log-returns (yk)/(-1. You want to build a CRR model for the evolution of the stock. The expected value and standard deviation of the log-returns are y = 0.06 and Sy 0.1. The money market interest rate is r = 0.04. Determine the risk-neutral probability of the model.arrow_forwardSeveral markets (Japan, Switzerland) introduced negative interest rates on their money market. In this problem, we will consider an annual interest rate r < 0. We consider a stock modeled by an N-period CRR model where each period is 1 year (At = 1) and the up and down factors are u and d. (a) We consider an American put option with strike price K and expiration T. Prove that if <0, the optimal strategy is to wait until expiration T to exercise.arrow_forward
arrow_back_ios
SEE MORE QUESTIONS
arrow_forward_ios
Recommended textbooks for you
 Glencoe Algebra 1, Student Edition, 9780079039897...AlgebraISBN:9780079039897Author:CarterPublisher:McGraw Hill
 Big Ideas Math A Bridge To Success Algebra 1: Stu...AlgebraISBN:9781680331141Author:HOUGHTON MIFFLIN HARCOURTPublisher:Houghton Mifflin Harcourt
 Functions and Change: A Modeling Approach to Coll...AlgebraISBN:9781337111348Author:Bruce Crauder, Benny Evans, Alan NoellPublisher:Cengage Learning
 Linear Algebra: A Modern IntroductionAlgebraISBN:9781285463247Author:David PoolePublisher:Cengage Learning
 Algebra and Trigonometry (MindTap Course List)AlgebraISBN:9781305071742Author:James Stewart, Lothar Redlin, Saleem WatsonPublisher:Cengage Learning
Glencoe Algebra 1, Student Edition, 9780079039897...
Algebra
ISBN:9780079039897
Author:Carter
Publisher:McGraw Hill
Big Ideas Math A Bridge To Success Algebra 1: Stu...
Algebra
ISBN:9781680331141
Author:HOUGHTON MIFFLIN HARCOURT
Publisher:Houghton Mifflin Harcourt
Functions and Change: A Modeling Approach to Coll...
Algebra
ISBN:9781337111348
Author:Bruce Crauder, Benny Evans, Alan Noell
Publisher:Cengage Learning
Linear Algebra: A Modern Introduction
Algebra
ISBN:9781285463247
Author:David Poole
Publisher:Cengage Learning
Algebra and Trigonometry (MindTap Course List)
Algebra
ISBN:9781305071742
Author:James Stewart, Lothar Redlin, Saleem Watson
Publisher:Cengage Learning
Correlation Vs Regression: Difference Between them with definition & Comparison Chart; Author: Key Differences;https://www.youtube.com/watch?v=Ou2QGSJVd0U;License: Standard YouTube License, CC-BY
Correlation and Regression: Concepts with Illustrative examples; Author: LEARN & APPLY : Lean and Six Sigma;https://www.youtube.com/watch?v=xTpHD5WLuoA;License: Standard YouTube License, CC-BY