Depression The September 1998 issue of the American T Psychologist published an article by Kraut et al. that reported on an experiment examining “the social and psychological impact of the Internet on 169 people in 73 households during their first 1 to 2 years online.” In the experiment, 73 households were offered free Internet access for 1 or 2 years in return for allowing their time and activity online to be tracked. The members of the households who participated in the study were also given a battery of tests at the beginning and again at the end of the study. The conclusion of the study made news headlines: Those who spent more time online tended to be more depressed at the end of the experiment. Although the paper reports a more complex model, the basic result can be summarized in the following regression of Depression (at the end of the study, in “depression scale units”) vs. Internet Use (in mean hours per week): Dependent variable is Depression R-squared = 4.6% s = 0.4563 The news reports about this study clearly concluded that using the Internet causes depression. Discuss whether such a conclusion can be drawn from this regression. If so, discuss the supporting evidence. If not, say why not.
Depression The September 1998 issue of the American T Psychologist published an article by Kraut et al. that reported on an experiment examining “the social and psychological impact of the Internet on 169 people in 73 households during their first 1 to 2 years online.” In the experiment, 73 households were offered free Internet access for 1 or 2 years in return for allowing their time and activity online to be tracked. The members of the households who participated in the study were also given a battery of tests at the beginning and again at the end of the study. The conclusion of the study made news headlines: Those who spent more time online tended to be more depressed at the end of the experiment. Although the paper reports a more complex model, the basic result can be summarized in the following regression of Depression (at the end of the study, in “depression scale units”) vs. Internet Use (in mean hours per week): Dependent variable is Depression R-squared = 4.6% s = 0.4563 The news reports about this study clearly concluded that using the Internet causes depression. Discuss whether such a conclusion can be drawn from this regression. If so, discuss the supporting evidence. If not, say why not.
Solution Summary: The author explains that the regression analysis of depression at the end of the study and the internet use in mean hours per week is given.
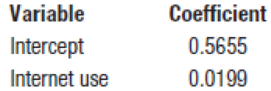
Depression The September 1998 issue of the American T Psychologist published an article by Kraut et al. that reported on an experiment examining “the social and psychological impact of the Internet on 169 people in 73 households during their first 1 to 2 years online.” In the experiment, 73 households were offered free Internet access for 1 or 2 years in return for allowing their time and activity online to be tracked. The members of the households who participated in the study were also given a battery of tests at the beginning and again at the end of the study. The conclusion of the study made news headlines: Those who spent more time online tended to be more depressed at the end of the experiment. Although the paper reports a more complex model, the basic result can be summarized in the following regression of Depression (at the end of the study, in “depression scale units”) vs. Internet Use (in mean hours per week):
Dependent variable is Depression
R-squared = 4.6% s = 0.4563
The news reports about this study clearly concluded that using the Internet causes depression. Discuss whether such a conclusion can be drawn from this regression. If so, discuss the supporting evidence. If not, say why not.
please find the answers for the yellows boxes using the information and the picture below
A marketing agency wants to determine whether different advertising platforms generate significantly different levels of customer engagement. The agency measures the average number of daily clicks on ads for three platforms: Social Media, Search Engines, and Email Campaigns. The agency collects data on daily clicks for each platform over a 10-day period and wants to test whether there is a statistically significant difference in the mean number of daily clicks among these platforms. Conduct ANOVA test.
You can provide your answer by inserting a text box and the answer must include: also please provide a step by on getting the answers in excel
Null hypothesis,
Alternative hypothesis,
Show answer (output table/summary table), and
Conclusion based on the P value.
A company found that the daily sales revenue of its flagship product follows a normal distribution with a mean of $4500 and a standard deviation of $450. The company defines a "high-sales day" that is, any day with sales exceeding $4800. please provide a step by step on how to get the answers
Q: What percentage of days can the company expect to have "high-sales days" or sales greater than $4800?
Q: What is the sales revenue threshold for the bottom 10% of days? (please note that 10% refers to the probability/area under bell curve towards the lower tail of bell curve)
Provide answers in the yellow cells
Need a deep-dive on the concept behind this application? Look no further. Learn more about this topic, statistics and related others by exploring similar questions and additional content below.
what is Research Design, Research Design Types, and Research Design Methods; Author: Educational Hub;https://www.youtube.com/watch?v=LpmGSioXxdo;License: Standard YouTube License, CC-BY


 Big Ideas Math A Bridge To Success Algebra 1: Stu...AlgebraISBN:9781680331141Author:HOUGHTON MIFFLIN HARCOURTPublisher:Houghton Mifflin Harcourt
 Glencoe Algebra 1, Student Edition, 9780079039897...AlgebraISBN:9780079039897Author:CarterPublisher:McGraw Hill
 College Algebra (MindTap Course List)AlgebraISBN:9781305652231Author:R. David Gustafson, Jeff HughesPublisher:Cengage Learning
 Holt Mcdougal Larson Pre-algebra: Student Edition...AlgebraISBN:9780547587776Author:HOLT MCDOUGALPublisher:HOLT MCDOUGAL