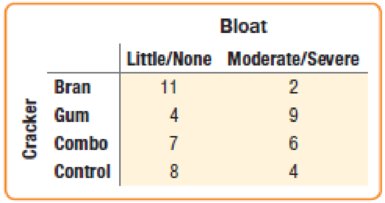
Diet Thirteen overweight women volunteered for a study to determine whether eating specially prepared crackers before a meal could help them lose weight. The subjects were randomly assigned to eat crackers with different types of fiber (bran fiber, gum fiber, both, and a control cracker). Unfortunately, some of the women developed uncomfortable bloating and upset stomachs. Researchers suspected that some of the crackers might be at fault. The contingency table of “Cracker” versus “Bloat” shows the relationship between the four different types of crackers and the reported bloating. The study was paid for by the manufacturers of the gum fiber. What would you recommend to them about the prospects for marketing their new diet cracker?
Diet Thirteen overweight women volunteered for a study to determine whether eating specially prepared crackers before a meal could help them lose weight. The subjects were randomly assigned to eat crackers with different types of fiber (bran fiber, gum fiber, both, and a control cracker). Unfortunately, some of the women developed uncomfortable bloating and upset stomachs. Researchers suspected that some of the crackers might be at fault. The contingency table of “Cracker” versus “Bloat” shows the relationship between the four different types of crackers and the reported bloating. The study was paid for by the manufacturers of the gum fiber. What would you recommend to them about the prospects for marketing their new diet cracker?
Solution Summary: The author explains that the company should research, develop, and address the problem before marketing the new diet cracker.
Diet Thirteen overweight women volunteered for a study to determine whether eating specially prepared crackers before a meal could help them lose weight. The subjects were randomly assigned to eat crackers with different types of fiber (bran fiber, gum fiber, both, and a control cracker). Unfortunately, some of the women developed uncomfortable bloating and upset stomachs. Researchers suspected that some of the crackers might be at fault. The contingency table of “Cracker” versus “Bloat” shows the relationship between the four different types of crackers and the reported bloating. The study was paid for by the manufacturers of the gum fiber. What would you recommend to them about the prospects for marketing their new diet cracker?
Definition Definition Visual representation of the relationship between two or more categorical variables. A contingency table is a categorical version of the scatterplot, which is used to visualize the linear relationship between two variables.
Task Description:
Read the following case study and answer the questions that follow.
Ella is a 9-year-old third-grade student in an inclusive classroom. She has been diagnosed with Emotional and Behavioural Disorder (EBD). She has been struggling academically and socially due to
challenges related to self-regulation, impulsivity, and emotional outbursts. Ella's behaviour includes frequent tantrums, defiance toward authority figures, and difficulty forming positive relationships with peers. Despite her challenges, Ella shows an interest in art and creative activities and demonstrates strong verbal skills when calm.
Describe 2 strategies that could be implemented that could help Ella regulate her emotions in class (4 marks)
Explain 2 strategies that could improve Ella’s social skills (4 marks)
Identify 2 accommodations that could be implemented to support Ella academic progress and provide a rationale for your recommendation.(6 marks)
Provide a detailed explanation of 2 ways…
Question 2: When John started his first job, his first end-of-year salary was $82,500. In the following years, he received salary raises as shown in the following table.
Fill the Table: Fill the following table showing his end-of-year salary for each year. I have already provided the end-of-year salaries for the first three years. Calculate the end-of-year salaries for the remaining years using Excel. (If you Excel answer for the top 3 cells is not the same as the one in the following table, your formula / approach is incorrect) (2 points)
Geometric Mean of Salary Raises: Calculate the geometric mean of the salary raises using the percentage figures provided in the second column named “% Raise”. (The geometric mean for this calculation should be nearly identical to the arithmetic mean. If your answer deviates significantly from the mean, it's likely incorrect. 2 points)
Starting salary
% Raise
Raise
Salary after raise
75000
10%
7500
82500
82500
4%
3300…
I need help with this problem and an explanation of the solution for the image described below. (Statistics: Engineering Probabilities)
Chapter R Solutions
Intro Stats, Books a la Carte Edition (5th Edition)
Need a deep-dive on the concept behind this application? Look no further. Learn more about this topic, statistics and related others by exploring similar questions and additional content below.
Hypothesis Testing - Solving Problems With Proportions; Author: The Organic Chemistry Tutor;https://www.youtube.com/watch?v=76VruarGn2Q;License: Standard YouTube License, CC-BY
Hypothesis Testing and Confidence Intervals (FRM Part 1 – Book 2 – Chapter 5); Author: Analystprep;https://www.youtube.com/watch?v=vth3yZIUlGQ;License: Standard YouTube License, CC-BY


 Glencoe Algebra 1, Student Edition, 9780079039897...AlgebraISBN:9780079039897Author:CarterPublisher:McGraw Hill
 College Algebra (MindTap Course List)AlgebraISBN:9781305652231Author:R. David Gustafson, Jeff HughesPublisher:Cengage Learning
 Big Ideas Math A Bridge To Success Algebra 1: Stu...AlgebraISBN:9781680331141Author:HOUGHTON MIFFLIN HARCOURTPublisher:Houghton Mifflin Harcourt
 Holt Mcdougal Larson Pre-algebra: Student Edition...AlgebraISBN:9780547587776Author:HOLT MCDOUGALPublisher:HOLT MCDOUGAL