Eye and hair color A survey of 1021 school-age children was conducted by randomly selecting children from several large urban elementary schools. Two of the questions concerned eye and hair color. In the survey, the following codes were used: Hair Color Eye Color 1 = Blond 1 = Blue 2 = Brown 2 = Green 3 = Black 3 = Brown 4 = Red 4 = Grey 5 = Other 5 = Other The statistics students analyzing the data were asked to study the relationship between eye and hair color. a) One group of students produced the output shown below. What kind of analysis is this? What are the null and alternative hypotheses? Is the analysis appropriate? If so, summarize the findings, being sure to include any assumptions you’ve made and/or limitations to the analysis. If it’s not an appropriate analysis, state explicitly why not. Dependent variable is Eyes R-squared = 3.7% s = 1.112 with 1021 - 2 = 1019 degrees of freedom b) A second group of students used the same data to produce the output shown below. The table displays counts and standardized residuals in each cell. What kind of analysis is this? What are the null and alternative hypotheses? Is the analysis appropriate? If so, summarize the findings, being sure to include any assumptions you’ve made and/or limitations to the analysis. If it’s not an appropriate analysis, state explicitly why not. ∑ ( O b s − E x p ) 2 E x p = 223.6 P-value < 0.00001
Eye and hair color A survey of 1021 school-age children was conducted by randomly selecting children from several large urban elementary schools. Two of the questions concerned eye and hair color. In the survey, the following codes were used: Hair Color Eye Color 1 = Blond 1 = Blue 2 = Brown 2 = Green 3 = Black 3 = Brown 4 = Red 4 = Grey 5 = Other 5 = Other The statistics students analyzing the data were asked to study the relationship between eye and hair color. a) One group of students produced the output shown below. What kind of analysis is this? What are the null and alternative hypotheses? Is the analysis appropriate? If so, summarize the findings, being sure to include any assumptions you’ve made and/or limitations to the analysis. If it’s not an appropriate analysis, state explicitly why not. Dependent variable is Eyes R-squared = 3.7% s = 1.112 with 1021 - 2 = 1019 degrees of freedom b) A second group of students used the same data to produce the output shown below. The table displays counts and standardized residuals in each cell. What kind of analysis is this? What are the null and alternative hypotheses? Is the analysis appropriate? If so, summarize the findings, being sure to include any assumptions you’ve made and/or limitations to the analysis. If it’s not an appropriate analysis, state explicitly why not. ∑ ( O b s − E x p ) 2 E x p = 223.6 P-value < 0.00001
Solution Summary: The author explains that the null and alternative hypothesis is not able to write this method because eye and hair color are categorical variables.
Eye and hair color A survey of 1021 school-age children was conducted by randomly selecting children from several large urban elementary schools. Two of the questions concerned eye and hair color. In the survey, the following codes were used:
Hair Color
Eye Color
1 = Blond
1 = Blue
2 = Brown
2 = Green
3 = Black
3 = Brown
4 = Red
4 = Grey
5 = Other
5 = Other
The statistics students analyzing the data were asked to study the relationship between eye and hair color.
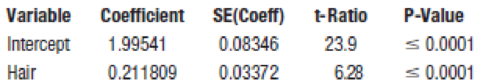
a) One group of students produced the output shown below. What kind of analysis is this? What are the null and alternative hypotheses? Is the analysis appropriate? If so, summarize the findings, being sure to include any assumptions you’ve made and/or limitations to the analysis. If it’s not an appropriate analysis, state explicitly why not.
Dependent variable is Eyes
R-squared = 3.7%
s = 1.112 with 1021 - 2 = 1019 degrees of freedom
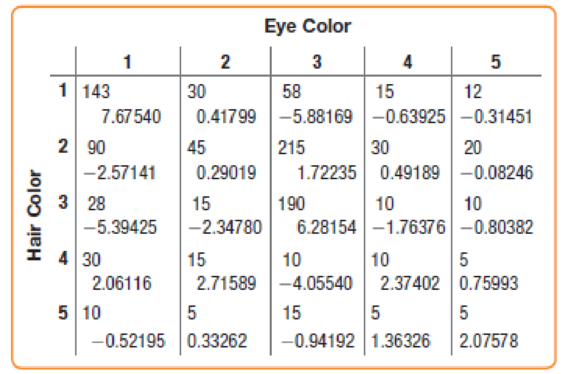
b) A second group of students used the same data to produce the output shown below. The table displays counts and standardized residuals in each cell. What kind of analysis is this? What are the null and alternative hypotheses? Is the analysis appropriate? If so, summarize the findings, being sure to include any assumptions you’ve made and/or limitations to the analysis. If it’s not an appropriate analysis, state explicitly why not.
∑
(
O
b
s
−
E
x
p
)
2
E
x
p
=
223.6
P-value
<
0.00001
08:34
◄ Classroom
07:59
Probs. 5-32/33
D
ا.
89
5-34. Determine the horizontal and vertical components
of reaction at the pin A and the normal force at the smooth
peg B on the member.
A
0,4 m
0.4 m
Prob. 5-34
F=600 N
fr
th
ar
0.
163586
5-37. The wooden plank resting between the buildings
deflects slightly when it supports the 50-kg boy. This
deflection causes a triangular distribution of load at its ends.
having maximum intensities of w, and wg. Determine w
and wg. each measured in N/m. when the boy is standing
3 m from one end as shown. Neglect the mass of the plank.
0.45 m
3 m
Examine the Variables: Carefully review and note the names of all variables in the dataset. Examples of these variables include:
Mileage (mpg)
Number of Cylinders (cyl)
Displacement (disp)
Horsepower (hp)
Research: Google to understand these variables.
Statistical Analysis: Select mpg variable, and perform the following statistical tests. Once you are done with these tests using mpg variable, repeat the same with hp
Mean
Median
First Quartile (Q1)
Second Quartile (Q2)
Third Quartile (Q3)
Fourth Quartile (Q4)
10th Percentile
70th Percentile
Skewness
Kurtosis
Document Your Results:
In RStudio: Before running each statistical test, provide a heading in the format shown at the bottom. “# Mean of mileage – Your name’s command”
In Microsoft Word: Once you've completed all tests, take a screenshot of your results in RStudio and paste it into a Microsoft Word document. Make sure that snapshots are very clear. You will need multiple snapshots. Also transfer these results to the…
Chapter R Solutions
Intro Stats, Books a la Carte Edition (5th Edition)
Need a deep-dive on the concept behind this application? Look no further. Learn more about this topic, statistics and related others by exploring similar questions and additional content below.
Hypothesis Testing using Confidence Interval Approach; Author: BUM2413 Applied Statistics UMP;https://www.youtube.com/watch?v=Hq1l3e9pLyY;License: Standard YouTube License, CC-BY
Hypothesis Testing - Difference of Two Means - Student's -Distribution & Normal Distribution; Author: The Organic Chemistry Tutor;https://www.youtube.com/watch?v=UcZwyzwWU7o;License: Standard Youtube License


 Holt Mcdougal Larson Pre-algebra: Student Edition...AlgebraISBN:9780547587776Author:HOLT MCDOUGALPublisher:HOLT MCDOUGAL
 Big Ideas Math A Bridge To Success Algebra 1: Stu...AlgebraISBN:9781680331141Author:HOUGHTON MIFFLIN HARCOURTPublisher:Houghton Mifflin Harcourt
 Glencoe Algebra 1, Student Edition, 9780079039897...AlgebraISBN:9780079039897Author:CarterPublisher:McGraw Hill
 College Algebra (MindTap Course List)AlgebraISBN:9781305652231Author:R. David Gustafson, Jeff HughesPublisher:Cengage Learning