
Intro Stats, Books a la Carte Edition (5th Edition)
5th Edition
ISBN: 9780134210285
Author: Richard D. De Veaux, Paul Velleman, David E. Bock
Publisher: PEARSON
expand_more
expand_more
format_list_bulleted
Videos
Textbook Question
Chapter R, Problem 2.51RE
Penguins again In Chapter 8 we learned about the extraordinary depth and duration of the dives taken by penguins. In that chapter we modeled a re-expression of Heart rate with the Duration (min) of dives. The data also include the depth of each dive. Here is an analysis that incorporates both variables:
Response variable is: LogHeartRate
R squared = 79.5% s = 0.0869
| Variable | Coefficient |
| Intercept | 1.99213 |
| Duration(min) | –0.04510 |
| Depth(m) | 0.000887 |
- a) What is an appropriate interpretation of the coefficient of Duration in this regression?
Here is a partial regression plot for the coefficient of Duration:
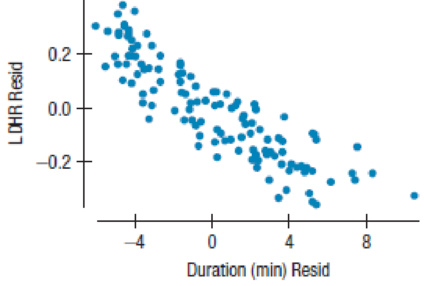
- b) Based on this plot, do you think the coefficient of Duration is a good estimate of the relationship of Duration to (log) Heart rate in these penguins? Explain.
Expert Solution & Answer
Want to see the full answer?
Check out a sample textbook solution
Students have asked these similar questions
08:34
◄ Classroom
07:59
Probs. 5-32/33
D
ا.
89
5-34. Determine the horizontal and vertical components
of reaction at the pin A and the normal force at the smooth
peg B on the member.
A
0,4 m
0.4 m
Prob. 5-34
F=600 N
fr
th
ar
0.
163586
5-37. The wooden plank resting between the buildings
deflects slightly when it supports the 50-kg boy. This
deflection causes a triangular distribution of load at its ends.
having maximum intensities of w, and wg. Determine w
and wg. each measured in N/m. when the boy is standing
3 m from one end as shown. Neglect the mass of the plank.
0.45 m
3 m
Examine the Variables: Carefully review and note the names of all variables in the dataset. Examples of these variables include:
Mileage (mpg)
Number of Cylinders (cyl)
Displacement (disp)
Horsepower (hp)
Research: Google to understand these variables.
Statistical Analysis: Select mpg variable, and perform the following statistical tests. Once you are done with these tests using mpg variable, repeat the same with hp
Mean
Median
First Quartile (Q1)
Second Quartile (Q2)
Third Quartile (Q3)
Fourth Quartile (Q4)
10th Percentile
70th Percentile
Skewness
Kurtosis
Document Your Results:
In RStudio: Before running each statistical test, provide a heading in the format shown at the bottom. “# Mean of mileage – Your name’s command”
In Microsoft Word: Once you've completed all tests, take a screenshot of your results in RStudio and paste it into a Microsoft Word document. Make sure that snapshots are very clear. You will need multiple snapshots. Also transfer these results to the…
Chapter R Solutions
Intro Stats, Books a la Carte Edition (5th Edition)
Ch. R - Bananas Here are the prices (in cents per pound)...Ch. R - Prob. 1.2RECh. R - Singers by parts The boxplots display the heights...Ch. R - Dialysis In a study of dialysis, researchers found...Ch. R - Beanstalks Beanstalk Clubs are social clubs for...Ch. R - Bread Clarksburg Bakery is trying to predict how...Ch. R - State University Public relations staff members at...Ch. R - Shenandoah rain Based on long-term investigation,...Ch. R - Prob. 1.9RECh. R - Streams As part of the course work, a class at an...
Ch. R - Prob. 1.11RECh. R - Prob. 1.12RECh. R - Lets play cards You pick a card from a standard...Ch. R - Accidents Progressive Insurance asked customers...Ch. R - Hard water In an investigation of environmental...Ch. R - Prob. 1.16RECh. R - Seasons Average daily temperatures in January and...Ch. R - Prob. 1.18RECh. R - Prob. 1.19RECh. R - Prob. 1.20RECh. R - Libertys nose Is the Statue of Libertys nose too...Ch. R - Winter Olympics 2010 speed skating The times from...Ch. R - Sample A study in South Africa focusing on the...Ch. R - Sluggers Babe Ruth was the first great slugger in...Ch. R - Prob. 1.25RECh. R - Music and memory Is it a good idea to listen to...Ch. R - Mail Here are the number of pieces of mail...Ch. R - Birth order Is your birth order related to your...Ch. R - Herbal medicine Researchers for the Herbal...Ch. R - Birth order revisited Consider again the data on...Ch. R - Engines One measure of the size of an automobile...Ch. R - Engines, again Horsepower is another measure...Ch. R - Prob. 1.33RECh. R - Prob. 1.34RECh. R - Age and party 2011 II Consider again the Pew...Ch. R - Prob. 1.36RECh. R - Prob. 1.37RECh. R - Global500 2014 Here is a stem-and-leaf display...Ch. R - Hopkins Forest investigation The Hopkins Forest...Ch. R - Prob. 1.42RECh. R - Prob. 1.43RECh. R - Prob. 1.44RECh. R - Matching Here are several scatterplots. The...Ch. R - Prob. 2.2RECh. R - Prob. 2.3RECh. R - Vineyards again Instead of Age, perhaps the Size...Ch. R - Prob. 2.5RECh. R - Prob. 2.6RECh. R - Prob. 2.7RECh. R - Prob. 2.8RECh. R - Prob. 2.9RECh. R - Prob. 2.10RECh. R - Prob. 2.11RECh. R - Prob. 2.12RECh. R - Traffic Highway planners investigated the...Ch. R - Prob. 2.14RECh. R - Cars, correlations What factor most explains...Ch. R - Cars, associations Look again at the correlation...Ch. R - Cars, horsepower Can we predict the Horsepower of...Ch. R - Prob. 2.18RECh. R - Prob. 2.19RECh. R - Prob. 2.20RECh. R - Prob. 2.21RECh. R - Prob. 2.22RECh. R - How old is that tree? One can determine how old a...Ch. R - Prob. 2.24RECh. R - Prob. 2.25RECh. R - Smoking and pregnancy 2011 The Child Trends Data...Ch. R - Prob. 2.27RECh. R - Prob. 2.28RECh. R - Prob. 2.29RECh. R - Correlations The study of U.S. cities in Exercise...Ch. R - Prob. 2.31RECh. R - Depression The September 1998 issue of the...Ch. R - Prob. 2.33RECh. R - Modeling jumps 2016 Here are the summary...Ch. R - French Consider the association between a students...Ch. R - Prob. 2.36RECh. R - Prob. 2.37RECh. R - Gasoline Since clean-air regulations have dictated...Ch. R - Prob. 2.39RECh. R - Prob. 2.40RECh. R - Prob. 2.41RECh. R - Prob. 2.42RECh. R - Prob. 2.43RECh. R - Prob. 2.44RECh. R - Prob. 2.45RECh. R - Prob. 2.46RECh. R - Prob. 2.47RECh. R - Prob. 2.48RECh. R - Prob. 2.49RECh. R - Prob. 2.50RECh. R - Penguins again In Chapter 8 we learned about the...Ch. R - Prob. 2.52RECh. R - R3.1R3.18. What design? Analyze the design of each...Ch. R - R3.1R3.18. What design? Analyze the design of each...Ch. R - Prob. 3.3RECh. R - Prob. 3.4RECh. R - R3.1R3.18. What design? Analyze the design of each...Ch. R - Prob. 3.6RECh. R - R3.1R3.18. What design? Analyze the design of each...Ch. R - R3.1R3.18. What design? Analyze the design of each...Ch. R - R3.1R3.18. What design? Analyze the design of each...Ch. R - R3.1R3.18. What design? Analyze the design of each...Ch. R - Prob. 3.11RECh. R - An artisan wants to create pottery that has the...Ch. R - Prob. 3.13RECh. R - R3.1R3.18. What design? Analyze the design of each...Ch. R - R3.1R3.18. What design? Analyze the design of each...Ch. R - R3.1R3.18. What design? Analyze the design of each...Ch. R - R3.1R3.18. What design? Analyze the design of each...Ch. R - R3.1R3.18. What design? Analyze the design of each...Ch. R - Prob. 3.19RECh. R - Prob. 3.20RECh. R - Alternate day fasting A paper published in 2017 in...Ch. R - Cell phone risks Researchers at the Washington...Ch. R - Prob. 3.23RECh. R - Prob. 3.24RECh. R - Prob. 3.25RECh. R - How long is 30 seconds? Sofie, Ryan, and...Ch. R - Cookies Mary Beth, Nigel, and Molly want to design...Ch. R - Homecoming A college statistics class conducted a...Ch. R - Youthful appearance Readers Digest (April 2002, p....Ch. R - Smoking and Alzheimers Medical studies indicate...Ch. R - Prob. 3.32RECh. R - Sex and violence Does the content of a television...Ch. R - Pubs In England, a Leeds University researcher...Ch. R - Age and party 2008 The Pew Research Center...Ch. R - Bias? Political analyst Michael Barone has written...Ch. R - Prob. 3.37RECh. R - Acupuncture Research reported in 2008 brings to...Ch. R - Fuel efficiency Wayne Collier designed an...Ch. R - Security There are 20 first-class passengers and...Ch. R - Internet speed Carsten, Matt, and Rainer designed...Ch. R - Prob. 4.1RECh. R - Prob. 4.2RECh. R - Emergency switch Safety engineers must determine...Ch. R - Prob. 4.4RECh. R - Prob. 4.5RECh. R - Prob. 4.6RECh. R - Babies The National Perinatal Statistics Unit of...Ch. R - Archery A champion archer can generally hit the...Ch. R - Color-blind Medical literature says that about 8%...Ch. R - Hamsters How large are hamster litters? Among 47...Ch. R - Prob. 4.11RECh. R - Polling 2016 The 2016 U.S. presidential election...Ch. R - Fake news In a survey of 1002 U.S. adults in...Ch. R - Scrabble Using a computer to play many simulated...Ch. R - Prob. 4.15RECh. R - Prob. 4.16RECh. R - Prob. 4.17RECh. R - Prob. 4.18RECh. R - Prob. 4.19RECh. R - Prob. 4.20RECh. R - Prob. 4.21RECh. R - Prob. 4.22RECh. R - Prob. 4.23RECh. R - Prob. 4.24RECh. R - Largemouth bass Organizers of a fishing tournament...Ch. R - Prob. 4.26RECh. R - Language Neurological research has shown that in...Ch. R - Prob. 4.28RECh. R - Teen smoking 2015 The Centers for Disease Control...Ch. R - Prob. 4.30RECh. R - Prob. 4.31RECh. R - Prob. 4.32RECh. R - Pregnant? Suppose that 70% of the women who...Ch. R - Safety Observers in Texas watched children at play...Ch. R - Prob. 4.35RECh. R - Prob. 4.36RECh. R - Prob. 4.37RECh. R - Grade inflation In 1996, 20% of all students at a...Ch. R - Prob. 4.39RECh. R - Prob. 4.40RECh. R - Prob. 4.41RECh. R - Prob. 4.42RECh. R - Prob. 4.43RECh. R - Prob. 4.44RECh. R - Prob. 4.45RECh. R - Prob. 4.46RECh. R - Streams Researchers in the Adirondack Mountains...Ch. R - Skin cancer In February 2012, MedPage Today...Ch. R - Bread Clarksburg Bakery is trying to predict how...Ch. R - Prob. 4.50RECh. R - Prob. 4.51RECh. R - Batteries We work for the Watchdog for the...Ch. R - Prob. 4.53RECh. R - Prob. 4.54RECh. R - Prob. 5.1RECh. R - Prob. 5.2RECh. R - Prob. 5.3RECh. R - Prob. 5.4RECh. R - Prob. 5.5RECh. R - Prob. 5.6RECh. R - Eclampsia deaths Refer again to the research...Ch. R - Prob. 5.8RECh. R - More errors A corporation with a fleet of vehicles...Ch. R - Preemies Among 242 Cleveland-area children born...Ch. R - Crawling A study found that babies born at...Ch. R - Mazes and smells Can pleasant smells improve...Ch. R - Pottery Archaeologists can use the chemical...Ch. R - Grant writing Does race matter when applying for...Ch. R - Feeding fish In the midwestern United States, a...Ch. R - Age In a study of how depression may affect ones...Ch. R - Prob. 5.18RECh. R - Eating disorders A study conducted in the...Ch. R - Cesareans Some people fear that differences in...Ch. R - Prob. 5.21RECh. R - Teach for America, part II The study described in...Ch. R - Prob. 5.25RECh. R - Genetics Two human traits controlled by a single...Ch. R - Prob. 5.29RECh. R - Hard water In an investigation of environmental...Ch. R - Prob. 5.31RECh. R - Prob. 5.32RECh. R - Prob. 5.33RECh. R - AP statistics scores 2016 In 2016, about 200,000...Ch. R - Prob. 5.35RECh. R - Prob. 5.36RECh. R - Prob. 5.37RECh. R - Age and party 2016 The Pew Research Center...Ch. R - Eye and hair color A survey of 1021 school-age...Ch. R - Prob. 5.40RECh. R - Prob. 5.41RECh. R - Prob. 5.42RECh. R - Prob. 5.43RECh. R - Prob. 5.44RECh. R - Prob. 5.45RECh. R - Learning math Developers of a new math curriculum...Ch. R - Prob. 5.47RECh. R - Dairy sales Peninsula Creameries sells both...Ch. R - Diet Thirteen overweight women volunteered for a...Ch. R - Cramming Students in two basic Spanish classes...Ch. R - Prob. 5.51RECh. R - Newspapers Who reads the newspaper more, men or...
Knowledge Booster


Learn more about
Need a deep-dive on the concept behind this application? Look no further. Learn more about this topic, statistics and related others by exploring similar questions and additional content below.Similar questions
- Examine the Variables: Carefully review and note the names of all variables in the dataset. Examples of these variables include: Mileage (mpg) Number of Cylinders (cyl) Displacement (disp) Horsepower (hp) Research: Google to understand these variables. Statistical Analysis: Select mpg variable, and perform the following statistical tests. Once you are done with these tests using mpg variable, repeat the same with hp Mean Median First Quartile (Q1) Second Quartile (Q2) Third Quartile (Q3) Fourth Quartile (Q4) 10th Percentile 70th Percentile Skewness Kurtosis Document Your Results: In RStudio: Before running each statistical test, provide a heading in the format shown at the bottom. “# Mean of mileage – Your name’s command” In Microsoft Word: Once you've completed all tests, take a screenshot of your results in RStudio and paste it into a Microsoft Word document. Make sure that snapshots are very clear. You will need multiple snapshots. Also transfer these results to the…arrow_forward2 (VaR and ES) Suppose X1 are independent. Prove that ~ Unif[-0.5, 0.5] and X2 VaRa (X1X2) < VaRa(X1) + VaRa (X2). ~ Unif[-0.5, 0.5]arrow_forward8 (Correlation and Diversification) Assume we have two stocks, A and B, show that a particular combination of the two stocks produce a risk-free portfolio when the correlation between the return of A and B is -1.arrow_forward
- 9 (Portfolio allocation) Suppose R₁ and R2 are returns of 2 assets and with expected return and variance respectively r₁ and 72 and variance-covariance σ2, 0%½ and σ12. Find −∞ ≤ w ≤ ∞ such that the portfolio wR₁ + (1 - w) R₂ has the smallest risk.arrow_forward7 (Multivariate random variable) Suppose X, €1, €2, €3 are IID N(0, 1) and Y2 Y₁ = 0.2 0.8X + €1, Y₂ = 0.3 +0.7X+ €2, Y3 = 0.2 + 0.9X + €3. = (In models like this, X is called the common factors of Y₁, Y₂, Y3.) Y = (Y1, Y2, Y3). (a) Find E(Y) and cov(Y). (b) What can you observe from cov(Y). Writearrow_forward1 (VaR and ES) Suppose X ~ f(x) with 1+x, if 0> x > −1 f(x) = 1−x if 1 x > 0 Find VaRo.05 (X) and ES0.05 (X).arrow_forward
- Joy is making Christmas gifts. She has 6 1/12 feet of yarn and will need 4 1/4 to complete our project. How much yarn will she have left over compute this solution in two different ways arrow_forwardSolve for X. Explain each step. 2^2x • 2^-4=8arrow_forwardOne hundred people were surveyed, and one question pertained to their educational background. The results of this question and their genders are given in the following table. Female (F) Male (F′) Total College degree (D) 30 20 50 No college degree (D′) 30 20 50 Total 60 40 100 If a person is selected at random from those surveyed, find the probability of each of the following events.1. The person is female or has a college degree. Answer: equation editor Equation Editor 2. The person is male or does not have a college degree. Answer: equation editor Equation Editor 3. The person is female or does not have a college degree.arrow_forward
arrow_back_ios
SEE MORE QUESTIONS
arrow_forward_ios
Recommended textbooks for you

 Algebra & Trigonometry with Analytic GeometryAlgebraISBN:9781133382119Author:SwokowskiPublisher:Cengage
 College Algebra (MindTap Course List)AlgebraISBN:9781305652231Author:R. David Gustafson, Jeff HughesPublisher:Cengage Learning
 Glencoe Algebra 1, Student Edition, 9780079039897...AlgebraISBN:9780079039897Author:CarterPublisher:McGraw Hill
 Algebra for College StudentsAlgebraISBN:9781285195780Author:Jerome E. Kaufmann, Karen L. SchwittersPublisher:Cengage Learning
 Big Ideas Math A Bridge To Success Algebra 1: Stu...AlgebraISBN:9781680331141Author:HOUGHTON MIFFLIN HARCOURTPublisher:Houghton Mifflin Harcourt
Algebra & Trigonometry with Analytic Geometry
Algebra
ISBN:9781133382119
Author:Swokowski
Publisher:Cengage
College Algebra (MindTap Course List)
Algebra
ISBN:9781305652231
Author:R. David Gustafson, Jeff Hughes
Publisher:Cengage Learning
Glencoe Algebra 1, Student Edition, 9780079039897...
Algebra
ISBN:9780079039897
Author:Carter
Publisher:McGraw Hill
Algebra for College Students
Algebra
ISBN:9781285195780
Author:Jerome E. Kaufmann, Karen L. Schwitters
Publisher:Cengage Learning
Big Ideas Math A Bridge To Success Algebra 1: Stu...
Algebra
ISBN:9781680331141
Author:HOUGHTON MIFFLIN HARCOURT
Publisher:Houghton Mifflin Harcourt
Implicit Differentiation with Transcendental Functions; Author: Mathispower4u;https://www.youtube.com/watch?v=16WoO59R88w;License: Standard YouTube License, CC-BY
How to determine the difference between an algebraic and transcendental expression; Author: Study Force;https://www.youtube.com/watch?v=xRht10w7ZOE;License: Standard YouTube License, CC-BY