
Fundamentals of Statistics (5th Edition)
5th Edition
ISBN: 9780134508306
Author: Michael Sullivan III
Publisher: PEARSON
expand_more
expand_more
format_list_bulleted
Concept explainers
Videos
Textbook Question
Chapter B.6, Problem 29AYU
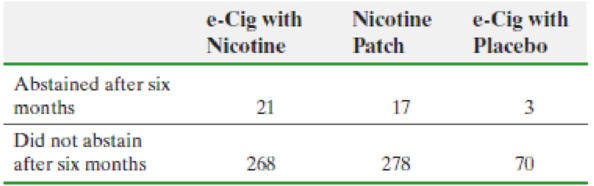
Another E-Cig Study In a study of adult smokers who wanted to quit, 657 subjects were randomly assigned to one of three treatment groups: subjects in Group 1 were given nicotine e-cigarettes, subjects in Group 2 were given nicotine patches, and subjects in Group 3 were given placebo e-cigarettes. The response variable was whether the subject maintained abstinence from cigarettes for six months, verified using exhaled breath carbon monoxide measurement.
- (a) What type of experimental design is this?
- (b) What is the response variable?
- (c) What are the treatments? How many levels does the treatment have?
- (d) Explain why it is not appropriate to use a one-way ANOVA to analyze the effectiveness of e-cigs with nicotine. Suggest an appropriate analysis.
- (e) The results of the study are shown to the right. Using the procedure suggested in part (d), perform the analysis regarding the effectiveness of the treatment. Be sure to state the null and alternative hypotheses.
Source: Bullen, Christopher, The Lancet Volume 382, Issue 9905, 16 Nov 2013 doi:10.1016/S0140-6736(13)61842-5
Expert Solution & Answer
Want to see the full answer?
Check out a sample textbook solution
Students have asked these similar questions
Stem1: 1,4
Stem 2: 2,4,8
Stem3: 2,4
Stem4: 0,1,6,8
Stem5: 0,1,2,3,9
Stem 6: 2,2
What’s the Min,Q1, Med,Q3,Max?
Are the t-statistics here greater than 1.96? What do you conclude?
colgPA= 1.39+0.412 hsGPA
(.33) (0.094)
Find the P value
A poll before the elections showed that in a given sample 79% of people vote for candidate C. How many people should be interviewed so that the pollsters can be 99% sure that from 75% to 83% of the population will vote for candidate C? Round your answer to the whole number.
Chapter B.6 Solutions
Fundamentals of Statistics (5th Edition)
Ch. B.6 - The acronym ANOVA stands for __________ __...Ch. B.6 - True or False: To perform a one-way ANOVA, the...Ch. B.6 - True or False: To perform a one-way ANOVA, the...Ch. B.6 - The variability among the sample means is called...Ch. B.6 - The variability within each treatment group, which...Ch. B.6 - True or False: The F-test statistic is F0=MSTMSE.Ch. B.6 - In Problems 7 and 8, fill in the ANOVA table. 7.Ch. B.6 - In Problems 7 and 8, fill in the ANOVA table. 8.Ch. B.6 - In Problems 9 and 10, determine the F-test...Ch. B.6 - In Problems 9 and 10, determine the F-test...
Ch. B.6 - NW 11. The following data represent a simple...Ch. B.6 - The following data represent a simple random...Ch. B.6 - NW 13. Corn Production The data in the table...Ch. B.6 - Soybean Yield The data in the table represent the...Ch. B.6 - Which Delivery Method Is Best? At a community...Ch. B.6 - Births by Day of Week An obstetrician knew that...Ch. B.6 - Rates of Return A stock analyst wondered whether...Ch. B.6 - Reaction Time In an online psychology experiment...Ch. B.6 - Car-Buying Discrimination To determine if there is...Ch. B.6 - Crash Data The Insurance Institute for Highway...Ch. B.6 - Lower Your Cholesterol Researcher Francisco...Ch. B.6 - pH in Rain An environmentalist wanted to determine...Ch. B.6 - Age and Politics Do peoples political philosophy...Ch. B.6 - Concrete Strength An engineer wants to know if the...Ch. B.6 - Analyzing Journal Article Results Researchers...Ch. B.6 - Prob. 27AYUCh. B.6 - Diversity and pH The following data represent the...Ch. B.6 - Another E-Cig Study In a study of adult smokers...Ch. B.6 - What are the requirements to perform a one-way...Ch. B.6 - What is the mean square due to treatment estimate...Ch. B.6 - Why does a large value of the F statistic provide...Ch. B.6 - In a one-way ANOVA, explain what it means to...
Knowledge Booster


Learn more about
Need a deep-dive on the concept behind this application? Look no further. Learn more about this topic, statistics and related others by exploring similar questions and additional content below.Similar questions
- Suppose a random sample of 459 married couples found that 307 had two or more personality preferences in common. In another random sample of 471 married couples, it was found that only 31 had no preferences in common. Let p1 be the population proportion of all married couples who have two or more personality preferences in common. Let p2 be the population proportion of all married couples who have no personality preferences in common. Find a95% confidence interval for . Round your answer to three decimal places.arrow_forwardA history teacher interviewed a random sample of 80 students about their preferences in learning activities outside of school and whether they are considering watching a historical movie at the cinema. 69 answered that they would like to go to the cinema. Let p represent the proportion of students who want to watch a historical movie. Determine the maximal margin of error. Use α = 0.05. Round your answer to three decimal places. arrow_forwardA random sample of medical files is used to estimate the proportion p of all people who have blood type B. If you have no preliminary estimate for p, how many medical files should you include in a random sample in order to be 99% sure that the point estimate will be within a distance of 0.07 from p? Round your answer to the next higher whole number.arrow_forward
- A clinical study is designed to assess the average length of hospital stay of patients who underwent surgery. A preliminary study of a random sample of 70 surgery patients’ records showed that the standard deviation of the lengths of stay of all surgery patients is 7.5 days. How large should a sample to estimate the desired mean to within 1 day at 95% confidence? Round your answer to the whole number.arrow_forwardA clinical study is designed to assess the average length of hospital stay of patients who underwent surgery. A preliminary study of a random sample of 70 surgery patients’ records showed that the standard deviation of the lengths of stay of all surgery patients is 7.5 days. How large should a sample to estimate the desired mean to within 1 day at 95% confidence? Round your answer to the whole number.arrow_forwardIn the experiment a sample of subjects is drawn of people who have an elbow surgery. Each of the people included in the sample was interviewed about their health status and measurements were taken before and after surgery. Are the measurements before and after the operation independent or dependent samples?arrow_forward
- iid 1. The CLT provides an approximate sampling distribution for the arithmetic average Ỹ of a random sample Y₁, . . ., Yn f(y). The parameters of the approximate sampling distribution depend on the mean and variance of the underlying random variables (i.e., the population mean and variance). The approximation can be written to emphasize this, using the expec- tation and variance of one of the random variables in the sample instead of the parameters μ, 02: YNEY, · (1 (EY,, varyi n For the following population distributions f, write the approximate distribution of the sample mean. (a) Exponential with rate ẞ: f(y) = ß exp{−ßy} 1 (b) Chi-square with degrees of freedom: f(y) = ( 4 ) 2 y = exp { — ½/ } г( (c) Poisson with rate λ: P(Y = y) = exp(-\} > y! y²arrow_forward2. Let Y₁,……., Y be a random sample with common mean μ and common variance σ². Use the CLT to write an expression approximating the CDF P(Ỹ ≤ x) in terms of µ, σ² and n, and the standard normal CDF Fz(·).arrow_forwardmatharrow_forward
- Compute the median of the following data. 32, 41, 36, 42, 29, 30, 40, 22, 25, 37arrow_forwardTask Description: Read the following case study and answer the questions that follow. Ella is a 9-year-old third-grade student in an inclusive classroom. She has been diagnosed with Emotional and Behavioural Disorder (EBD). She has been struggling academically and socially due to challenges related to self-regulation, impulsivity, and emotional outbursts. Ella's behaviour includes frequent tantrums, defiance toward authority figures, and difficulty forming positive relationships with peers. Despite her challenges, Ella shows an interest in art and creative activities and demonstrates strong verbal skills when calm. Describe 2 strategies that could be implemented that could help Ella regulate her emotions in class (4 marks) Explain 2 strategies that could improve Ella’s social skills (4 marks) Identify 2 accommodations that could be implemented to support Ella academic progress and provide a rationale for your recommendation.(6 marks) Provide a detailed explanation of 2 ways…arrow_forwardQuestion 2: When John started his first job, his first end-of-year salary was $82,500. In the following years, he received salary raises as shown in the following table. Fill the Table: Fill the following table showing his end-of-year salary for each year. I have already provided the end-of-year salaries for the first three years. Calculate the end-of-year salaries for the remaining years using Excel. (If you Excel answer for the top 3 cells is not the same as the one in the following table, your formula / approach is incorrect) (2 points) Geometric Mean of Salary Raises: Calculate the geometric mean of the salary raises using the percentage figures provided in the second column named “% Raise”. (The geometric mean for this calculation should be nearly identical to the arithmetic mean. If your answer deviates significantly from the mean, it's likely incorrect. 2 points) Starting salary % Raise Raise Salary after raise 75000 10% 7500 82500 82500 4% 3300…arrow_forward
arrow_back_ios
SEE MORE QUESTIONS
arrow_forward_ios
Recommended textbooks for you
 Glencoe Algebra 1, Student Edition, 9780079039897...AlgebraISBN:9780079039897Author:CarterPublisher:McGraw Hill
 College Algebra (MindTap Course List)AlgebraISBN:9781305652231Author:R. David Gustafson, Jeff HughesPublisher:Cengage Learning
Glencoe Algebra 1, Student Edition, 9780079039897...
Algebra
ISBN:9780079039897
Author:Carter
Publisher:McGraw Hill
College Algebra (MindTap Course List)
Algebra
ISBN:9781305652231
Author:R. David Gustafson, Jeff Hughes
Publisher:Cengage Learning
Statistics 4.1 Point Estimators; Author: Dr. Jack L. Jackson II;https://www.youtube.com/watch?v=2MrI0J8XCEE;License: Standard YouTube License, CC-BY
Statistics 101: Point Estimators; Author: Brandon Foltz;https://www.youtube.com/watch?v=4v41z3HwLaM;License: Standard YouTube License, CC-BY
Central limit theorem; Author: 365 Data Science;https://www.youtube.com/watch?v=b5xQmk9veZ4;License: Standard YouTube License, CC-BY
Point Estimate Definition & Example; Author: Prof. Essa;https://www.youtube.com/watch?v=OTVwtvQmSn0;License: Standard Youtube License
Point Estimation; Author: Vamsidhar Ambatipudi;https://www.youtube.com/watch?v=flqhlM2bZWc;License: Standard Youtube License