Concept explainers
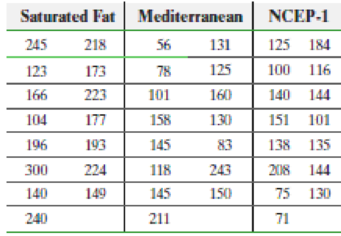
Lower Your Cholesterol Researcher Francisco Fuentes and his colleagues wanted to determine the most effective diet for reducing LDL cholesterol, the so-called “bad” cholesterol, among three diets: (1) a saturated-fat diet: 15% protein, 47% carbohydrates, and 38% fat (20% saturated fat, 12% monounsaturated fat, and 6% polyunsaturated fat); (2) the Mediterranean diet: 47% carbohydrates, and 38% fat (10% saturated fat, 22% monounsaturated fat, and 6% polyunsaturated fat); and (3) the US National Cholesterol Education Program or NCEP-1 Diet: 10% saturated fat, 12% monounsaturated fat, and 6% polyunsaturated fat. Participants in the study were shown to have the same levels of LDL cholesterol before the study and were randomly assigned to one of the three diets, or treatment groups. After 28 days, their LDL cholesterol levels were recorded. The data in the following table are based on this study.

- (a) Why is this study a completely randomized design?
- (b) What is the response variable? What is the explanatory variable that is controlled and set at three levels?
- (c) The participants were randomly assigned to one of three treatment groups. What is the purpose of randomization in this study?
- (d) State the null and alternative hypotheses.
- (e) Verify that the requirements to use the one-way ANOVA procedure are satisfied. Normal probability plots indicate that the sample data come from normal populations.
- (f) Are the
mean LDL cholesterol levels different at the α = 0.05 level of significance? - (g) Draw boxplots of the LDL cholesterol levels for the three groups to support the analytic results obtained in part (f).
Learn your wayIncludes step-by-step video

Chapter B.6 Solutions
Fundamentals of Statistics (5th Edition)
Additional Math Textbook Solutions
Calculus: Early Transcendentals (2nd Edition)
A Problem Solving Approach To Mathematics For Elementary School Teachers (13th Edition)
Elementary Statistics (13th Edition)
Calculus for Business, Economics, Life Sciences, and Social Sciences (14th Edition)
Calculus: Early Transcendentals (2nd Edition)
A First Course in Probability (10th Edition)
- A well-known company predominantly makes flat pack furniture for students. Variability with the automated machinery means the wood components are cut with a standard deviation in length of 0.45 mm. After they are cut the components are measured. If their length is more than 1.2 mm from the required length, the components are rejected. a) Calculate the percentage of components that get rejected. b) In a manufacturing run of 1000 units, how many are expected to be rejected? c) The company wishes to install more accurate equipment in order to reduce the rejection rate by one-half, using the same ±1.2mm rejection criterion. Calculate the maximum acceptable standard deviation of the new process.arrow_forward5. Let X and Y be independent random variables and let the superscripts denote symmetrization (recall Sect. 3.6). Show that (X + Y) X+ys.arrow_forward8. Suppose that the moments of the random variable X are constant, that is, suppose that EX" =c for all n ≥ 1, for some constant c. Find the distribution of X.arrow_forward
- 9. The concentration function of a random variable X is defined as Qx(h) = sup P(x ≤ X ≤x+h), h>0. Show that, if X and Y are independent random variables, then Qx+y (h) min{Qx(h). Qr (h)).arrow_forward10. Prove that, if (t)=1+0(12) as asf->> O is a characteristic function, then p = 1.arrow_forward9. The concentration function of a random variable X is defined as Qx(h) sup P(x ≤x≤x+h), h>0. (b) Is it true that Qx(ah) =aQx (h)?arrow_forward
- 3. Let X1, X2,..., X, be independent, Exp(1)-distributed random variables, and set V₁₁ = max Xk and W₁ = X₁+x+x+ Isk≤narrow_forward7. Consider the function (t)=(1+|t|)e, ER. (a) Prove that is a characteristic function. (b) Prove that the corresponding distribution is absolutely continuous. (c) Prove, departing from itself, that the distribution has finite mean and variance. (d) Prove, without computation, that the mean equals 0. (e) Compute the density.arrow_forward1. Show, by using characteristic, or moment generating functions, that if fx(x) = ½ex, -∞0 < x < ∞, then XY₁ - Y2, where Y₁ and Y2 are independent, exponentially distributed random variables.arrow_forward
- 1. Show, by using characteristic, or moment generating functions, that if 1 fx(x): x) = ½exarrow_forward1990) 02-02 50% mesob berceus +7 What's the probability of getting more than 1 head on 10 flips of a fair coin?arrow_forward9. The concentration function of a random variable X is defined as Qx(h) sup P(x≤x≤x+h), h>0. = x (a) Show that Qx+b(h) = Qx(h).arrow_forward
