
Concept explainers
Videos
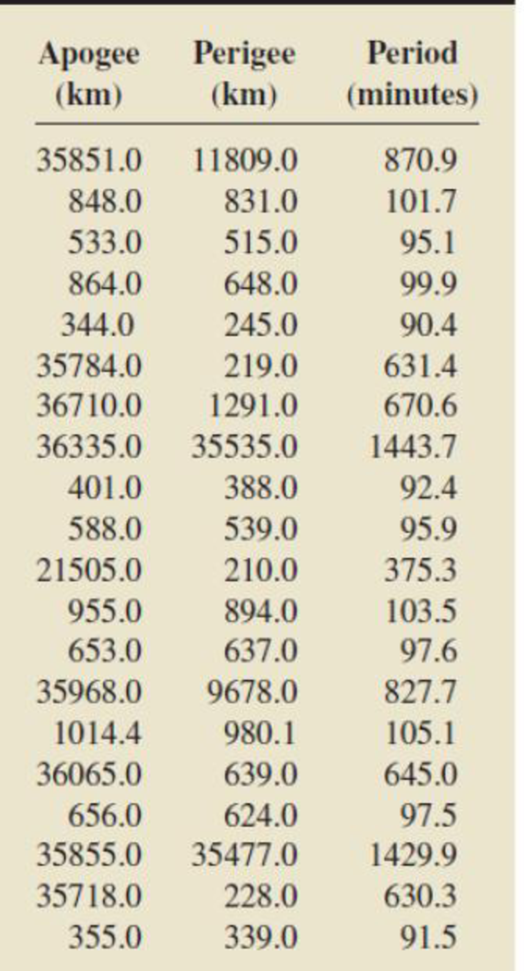
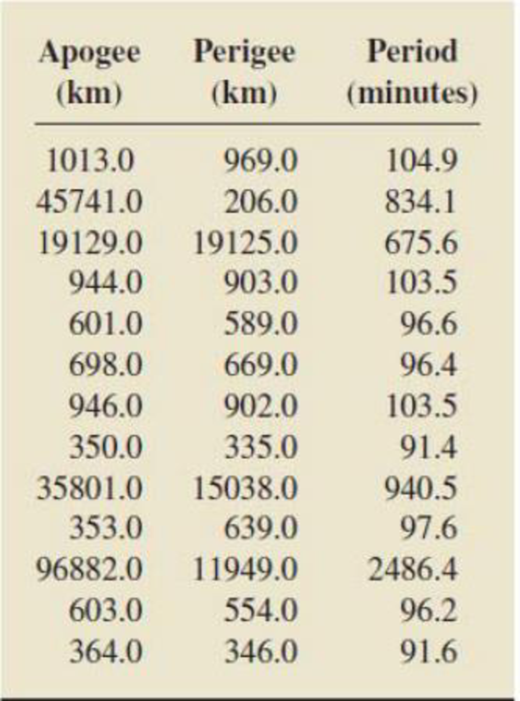
Satellite Orbits. Each issue of the magazine Ad Astra presents a list of space satellites that are launched into earth orbit during a two-month period. Also provided are the period of the satellite (time required to make one orbit of the earth), the apogee of the satellite (maximum distance from the earth), and the perigee of the satellite (minimum distance from the earth). The table below displays data on satellites placed in earth orbit from November 1998 through April, 1999 (Ad Astra, 11, Numbers 2, 3, 4). Multiple satellites placed in the same orbit during a single launch are listed as one observation only. We want to develop a second-order polynomial regression equation relating satellite period to apogee and perigee. (Readers interested in astronomy should investigate why this is an appropriate model.) Use the technology of your choice to do the following.
- a. Obtain a
scatterplot matrix for the observed values of period, apogee, and perigee. What do these plots indicate about the relationship between period and apogee? between period and perigee? - b. Obtain a three-dimensional scatterplot of period versus apogee and perigee. What does this plot indicate about the relationship between period and the two predictor variables apogee and perigee?
- c. Obtain the
correlation coefficients between period and the first- and second-order terms in the centered predictor variables apogeec and perigeec. Which terms are most highly correlated with period? What are the correlation coefficients between the first- and second-order terms? Will thesecorrelations adversely affect the ability to assess the effect of a term in the presence of the other terms? Explain your answer. - d. Perform a second-order polynomial
regression analysis for period using the centered predictor variables apogeec and perigeec. Based on the t-tests for the individual utility of each term in the model, which terms would you retain in the regression equation? Is it appropriate to use the t-tests here?
- e. Obtain plots of residuals versus fitted values, residuals versus apogeeC, and residuals versus perigeec, and also a normal probability plot of the residuals. Assess the appropriateness of the second-order polynomial regression equation, the assumption of constant conditional standard deviations, and the assumption of normality of the conditional distributions. Check for outliers and influential observations.
- f. Does your analysis in part (e) reveal any violations of the assumptions for regression inferences? Explain.
- g. Would it be appropriate to use the second-order polynomial regression equation obtained here to predict the period of the moon? Explain your answer.

Learn your wayIncludes step-by-step video

Chapter B Solutions
Introductory Statistics, Books a la Carte Plus NEW MyLab Statistics with Pearson eText -- Access Card Package (10th Edition)
Additional Math Textbook Solutions
A Problem Solving Approach To Mathematics For Elementary School Teachers (13th Edition)
University Calculus: Early Transcendentals (4th Edition)
Thinking Mathematically (6th Edition)
Elementary Statistics: Picturing the World (7th Edition)
Elementary Statistics
College Algebra (7th Edition)


- An electronics company manufactures batches of n circuit boards. Before a batch is approved for shipment, m boards are randomly selected from the batch and tested. The batch is rejected if more than d boards in the sample are found to be faulty. a) A batch actually contains six faulty circuit boards. Find the probability that the batch is rejected when n = 20, m = 5, and d = 1. b) A batch actually contains nine faulty circuit boards. Find the probability that the batch is rejected when n = 30, m = 10, and d = 1.arrow_forwardTwenty-eight applicants interested in working for the Food Stamp program took an examination designed to measure their aptitude for social work. A stem-and-leaf plot of the 28 scores appears below, where the first column is the count per branch, the second column is the stem value, and the remaining digits are the leaves. a) List all the values. Count 1 Stems Leaves 4 6 1 4 6 567 9 3688 026799 9 8 145667788 7 9 1234788 b) Calculate the first quartile (Q1) and the third Quartile (Q3). c) Calculate the interquartile range. d) Construct a boxplot for this data.arrow_forwardPam, Rob and Sam get a cake that is one-third chocolate, one-third vanilla, and one-third strawberry as shown below. They wish to fairly divide the cake using the lone chooser method. Pam likes strawberry twice as much as chocolate or vanilla. Rob only likes chocolate. Sam, the chooser, likes vanilla and strawberry twice as much as chocolate. In the first division, Pam cuts the strawberry piece off and lets Rob choose his favorite piece. Based on that, Rob chooses the chocolate and vanilla parts. Note: All cuts made to the cake shown below are vertical.Which is a second division that Rob would make of his share of the cake?arrow_forward
- Three players (one divider and two choosers) are going to divide a cake fairly using the lone divider method. The divider cuts the cake into three slices (s1, s2, and s3). If the choosers' declarations are Chooser 1: {s1 , s2} and Chooser 2: {s2 , s3}. Using the lone-divider method, how many different fair divisions of this cake are possible?arrow_forwardTheorem 2.6 (The Minkowski inequality) Let p≥1. Suppose that X and Y are random variables, such that E|X|P <∞ and E|Y P <00. Then X+YpX+Yparrow_forwardTheorem 1.2 (1) Suppose that P(|X|≤b) = 1 for some b > 0, that EX = 0, and set Var X = 0². Then, for 0 0, P(X > x) ≤e-x+1²² P(|X|>x) ≤2e-1x+1²² (ii) Let X1, X2...., Xn be independent random variables with mean 0, suppose that P(X ≤b) = 1 for all k, and set oσ = Var X. Then, for x > 0. and 0x) ≤2 exp Σ k=1 (iii) If, in addition, X1, X2, X, are identically distributed, then P(S|x) ≤2 expl-tx+nt²o).arrow_forward
- Theorem 5.1 (Jensen's inequality) state without proof the Jensen's Ineg. Let X be a random variable, g a convex function, and suppose that X and g(X) are integrable. Then g(EX) < Eg(X).arrow_forwardCan social media mistakes hurt your chances of finding a job? According to a survey of 1,000 hiring managers across many different industries, 76% claim that they use social media sites to research prospective candidates for any job. Calculate the probabilities of the following events. (Round your answers to three decimal places.) answer parts a-c. a) Out of 30 job listings, at least 19 will conduct social media screening. b) Out of 30 job listings, fewer than 17 will conduct social media screening. c) Out of 30 job listings, exactly between 19 and 22 (including 19 and 22) will conduct social media screening. show all steps for probabilities please. answer parts a-c.arrow_forwardQuestion: we know that for rt. (x+ys s ا. 13. rs. and my so using this, show that it vye and EIXI, EIYO This : E (IX + Y) ≤2" (EIX (" + Ely!")arrow_forward
- Theorem 2.4 (The Hölder inequality) Let p+q=1. If E|X|P < ∞ and E|Y| < ∞, then . |EXY ≤ E|XY|||X|| ||||qarrow_forwardTheorem 7.6 (Etemadi's inequality) Let X1, X2, X, be independent random variables. Then, for all x > 0, P(max |S|>3x) ≤3 max P(S| > x). Isk≤narrow_forwardTheorem 7.2 Suppose that E X = 0 for all k, that Var X = 0} x) ≤ 2P(S>x 1≤k≤n S√2), -S√2). P(max Sk>x) ≤ 2P(|S|>x- 1arrow_forwardarrow_back_iosSEE MORE QUESTIONSarrow_forward_ios
 Algebra & Trigonometry with Analytic GeometryAlgebraISBN:9781133382119Author:SwokowskiPublisher:Cengage