
Concept explainers
Videos
Mental Tasks and Drugs. In the text Statistical Theory and Methodology in Science and Engineering (New York: Wiley. I960). K. A. Brownlee provides data on an experiment involving a person's ability to perform a mental task before and after taking one of four drugs. Fifty-six subjects performed a task that involved mental addition. The subjects were then randomly divided into four groups. Each group drank a beverage containing one of four drugs, labeled A, B, C, and D. After a period of time for the drugs to take effect, each subject repeated the mental addition test. We want to relate the after test score (after) to the before test score (before) and the drug that was taken. The data from the experiment are presented in the following table.
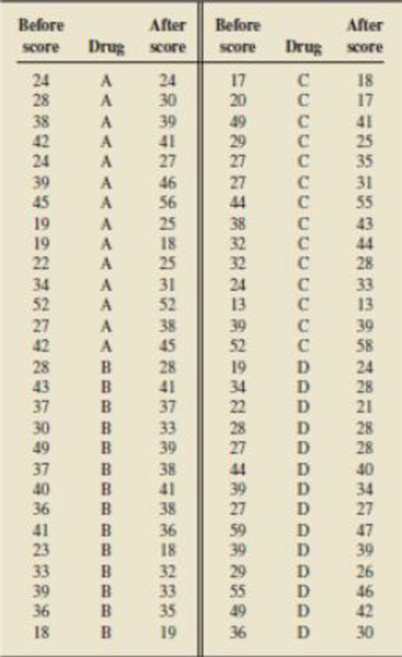
In this study, the drug labeled B was a placebo, that is, it contained no drug and should have no effect on a person’s ability to perform a mental task. Define three indicator variables as follows:
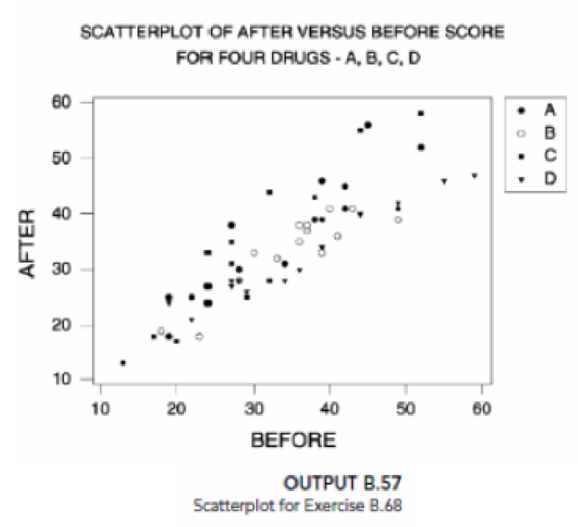
- a. Output B.57 on page B-93 provides a plot of after versus before, using a different plot symbol for each drug. Bases on this plot, does it appear that drug is a useful predictor variable? Explain your answer.
- b. We obtained the
regression analysis of after on before and the three indicator variables druga, drugc, and drugd, as shown in Output B.55 on page B-93. Conduct the t-tests for the individual utility of the four predictor variables at the 5% level of significance. Interpret your results. - c. Explain what the t-test for the utility of the indicator variable druga means in terms of comparing the effect of drug A to the effect of the placebo on the after mental task scores.
- d. Which drugs have on effect on the after mental task score that is different from the placebo?
- e. Based on Output B.58, obtain 1he regression equations relating after to before for each of the four drugs.
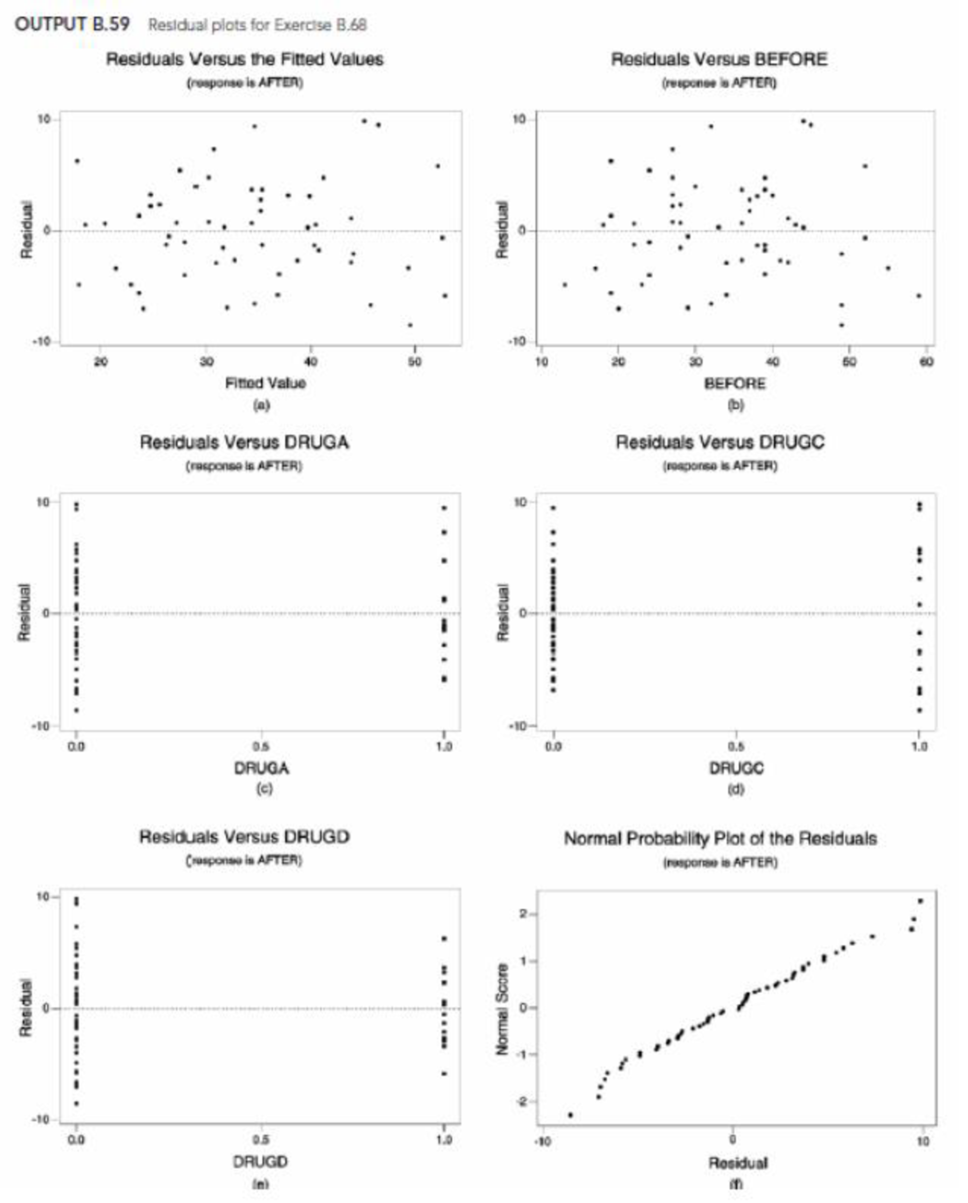
- f. Outputs B.59(a)–(f) provide, respectively, plots of residuals versus fitted values, residuals versus before, and residuals versus each indicator variable, and a normal probability plot of the residuals. Perform a residual analysis to assess the appropriateness of the regression equation, constancy of the conditional standard deviations, and normality of the conditional distributions. Check for outliers and influential observations.
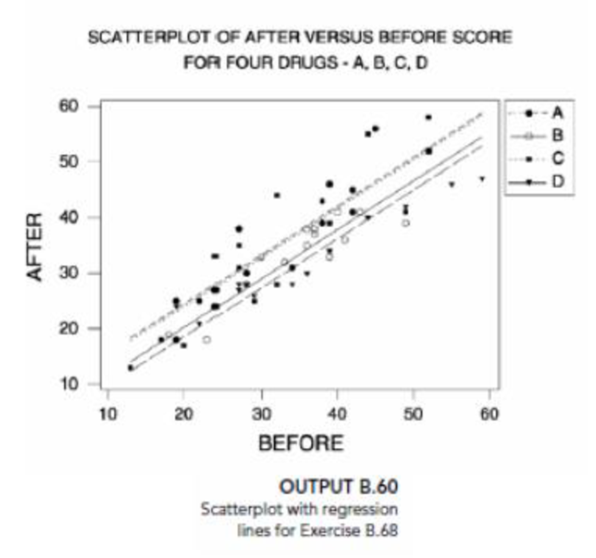
- g. Output B.60 on page B-95 provides a
scatterplot of after versus before with the regression lines for the four drugs. Based on this output and your residual analysis in part (f), do you feel that this model fits the data well? Explain your answer. - h. To check for possible interactions between the before score and. the drug, we obtained the regression analysis of after on before, druga, drugc, drugd, druga·before, drugc·before and drugd·before. The output is in Output B.61 on page B-96. Is there an interaction between drug and before, that is, are any of the cross-product terms useful predictor variables in the regression equation that contains the other terms in the model? Use α = 0.05.
Regression Analysis: AFTER versus BEFORE, DRUDA, DRUGC, DRUGD
Analysis of Variance
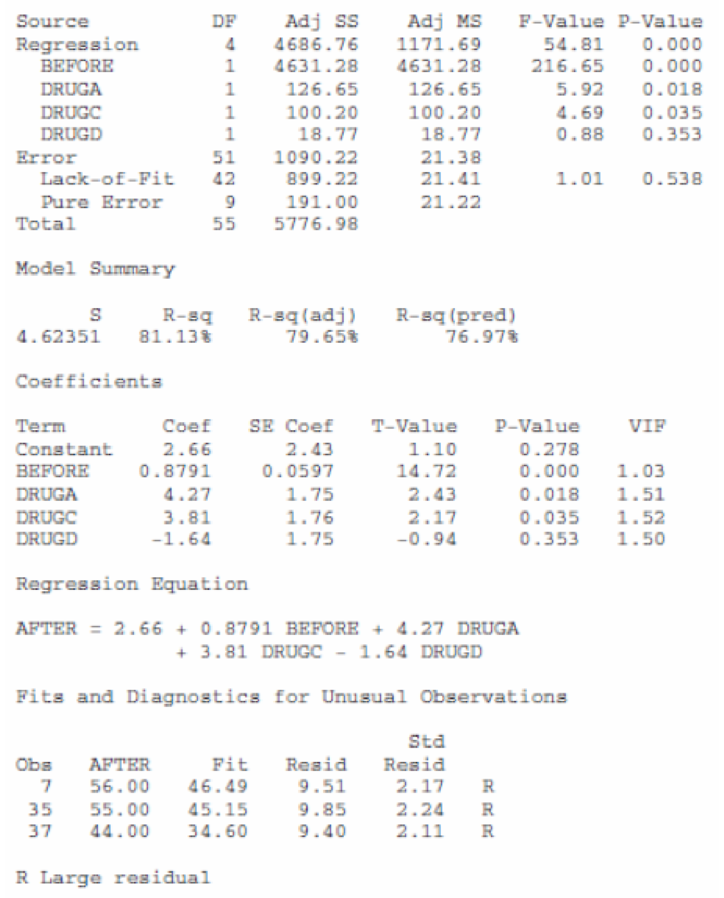
OUTPUT B.58 Regression output for Exercise B.68
Regression Analysis: AFTER versus BEFORE, DRUDA, DRUGC, DRUGD, DRUGA*BEF, DRUGC*BEF, …
Analysis of Variance
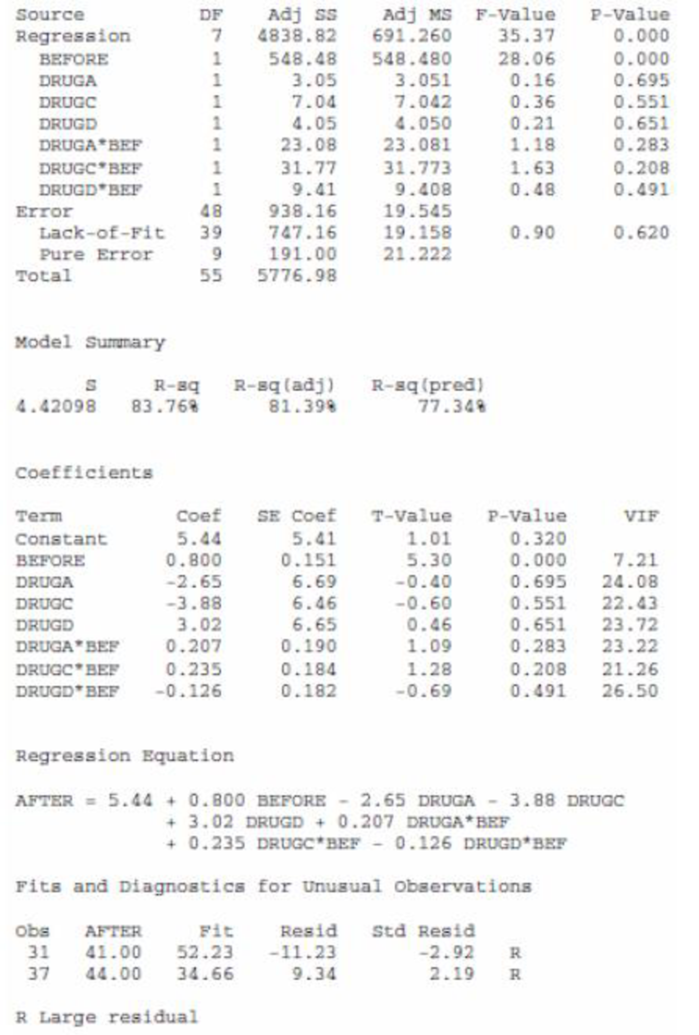
OUTPUT B.61 Regression output For Exercise B.68
Want to see the full answer?
Check out a sample textbook solution
Chapter B Solutions
Introductory Statistics, Books a la Carte Plus NEW MyLab Statistics with Pearson eText -- Access Card Package (10th Edition)


- Find the critical value for a left-tailed test using the F distribution with a 0.025, degrees of freedom in the numerator=12, and degrees of freedom in the denominator = 50. A portion of the table of critical values of the F-distribution is provided. Click the icon to view the partial table of critical values of the F-distribution. What is the critical value? (Round to two decimal places as needed.)arrow_forwardA retail store manager claims that the average daily sales of the store are $1,500. You aim to test whether the actual average daily sales differ significantly from this claimed value. You can provide your answer by inserting a text box and the answer must include: Null hypothesis, Alternative hypothesis, Show answer (output table/summary table), and Conclusion based on the P value. Showing the calculation is a must. If calculation is missing,so please provide a step by step on the answers Numerical answers in the yellow cellsarrow_forwardShow all workarrow_forward
- Show all workarrow_forwardplease find the answers for the yellows boxes using the information and the picture belowarrow_forwardA marketing agency wants to determine whether different advertising platforms generate significantly different levels of customer engagement. The agency measures the average number of daily clicks on ads for three platforms: Social Media, Search Engines, and Email Campaigns. The agency collects data on daily clicks for each platform over a 10-day period and wants to test whether there is a statistically significant difference in the mean number of daily clicks among these platforms. Conduct ANOVA test. You can provide your answer by inserting a text box and the answer must include: also please provide a step by on getting the answers in excel Null hypothesis, Alternative hypothesis, Show answer (output table/summary table), and Conclusion based on the P value.arrow_forward
 Functions and Change: A Modeling Approach to Coll...AlgebraISBN:9781337111348Author:Bruce Crauder, Benny Evans, Alan NoellPublisher:Cengage Learning
 Glencoe Algebra 1, Student Edition, 9780079039897...AlgebraISBN:9780079039897Author:CarterPublisher:McGraw Hill
 Holt Mcdougal Larson Pre-algebra: Student Edition...AlgebraISBN:9780547587776Author:HOLT MCDOUGALPublisher:HOLT MCDOUGAL
 College Algebra (MindTap Course List)AlgebraISBN:9781305652231Author:R. David Gustafson, Jeff HughesPublisher:Cengage Learning