
Introductory Statistics, Books a la Carte Plus NEW MyLab Statistics with Pearson eText -- Access Card Package (10th Edition)
10th Edition
ISBN: 9780134270364
Author: Neil A. Weiss
Publisher: PEARSON
expand_more
expand_more
format_list_bulleted
Concept explainers
Videos
Textbook Question
Chapter B.6, Problem 118E
Suppose that x1, x2, x3, and x4 are predictor variables for a response variable y. The following table gives the value of R1,
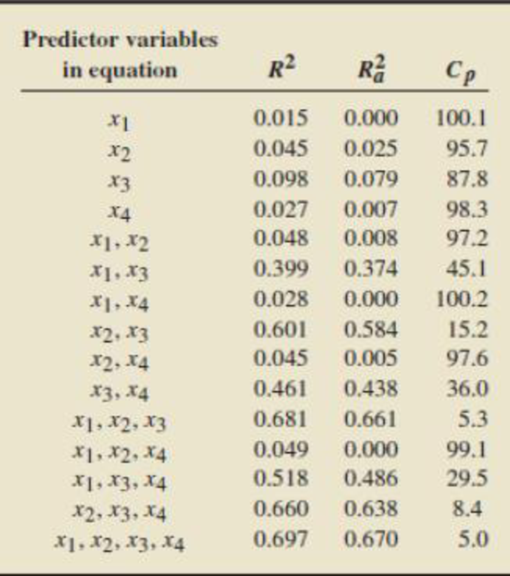
Employ the table to do the following.
- a. Use the maximum-R2 criterion to obtain a regression equation for these data.
- b. Use the adjusted- R2 criterion to obtain a regression equation for these data.
- c. Use the Mallows’ Cp criterion to obtain a regression equation for these data.
- d. Are the regression equations obtained in parts (a), (b), and (c) the same?
Expert Solution & Answer
Want to see the full answer?
Check out a sample textbook solution
Students have asked these similar questions
Test the claim that a student's pulse rate is different when taking a quiz than attending a regular class. The mean pulse rate difference is 2.7 with 10 students. Use a significance level of 0.005.
Pulse rate difference(Quiz - Lecture)
2
-1
5
-8
1
20
15
-4
9
-12
The following ordered data list shows the data speeds for cell phones used by a
telephone company at an airport:
A. Calculate the Measures of Central Tendency from the ungrouped data list.
B. Group the data in an appropriate frequency table.
C. Calculate the Measures of Central Tendency using the table in point B.
D. Are there differences in the measurements obtained in A and C? Why (give at
least one justified reason)?
I leave the answers to A and B to resolve the remaining two.
0.8
1.4
1.8
1.9
3.2
3.6
4.5
4.5
4.6
6.2
6.5
7.7
7.9
9.9
10.2
10.3
10.9
11.1
11.1
11.6
11.8
12.0
13.1
13.5
13.7
14.1
14.2
14.7
15.0
15.1
15.5
15.8
16.0
17.5
18.2
20.2
21.1
21.5
22.2
22.4
23.1
24.5
25.7
28.5
34.6
38.5
43.0
55.6
71.3
77.8
A. Measures of Central Tendency
We are to calculate:
Mean, Median, Mode
The data (already ordered) is:
0.8, 1.4, 1.8, 1.9, 3.2, 3.6, 4.5, 4.5, 4.6, 6.2, 6.5, 7.7, 7.9, 9.9, 10.2, 10.3, 10.9,
11.1, 11.1, 11.6,
11.8, 12.0, 13.1, 13.5, 13.7, 14.1, 14.2, 14.7, 15.0, 15.1, 15.5,…
PEER REPLY 1:
Choose a classmate's Main Post.
1. Indicate a range of values for the independent variable (x) that is reasonable
based on the data provided.
2. Explain what the predicted range of dependent values should be based on
the range of independent values.
Chapter B Solutions
Introductory Statistics, Books a la Carte Plus NEW MyLab Statistics with Pearson eText -- Access Card Package (10th Edition)
Ch. B.1 - Regarding the regression of a response variable,...Ch. B.1 - Fill in the blanks. a. The assumption that all...Ch. B.1 - Answer true or false to each of the following...Ch. B.1 - Prob. 4ECh. B.1 - In each of Exercises B.5B.14, a. decide whether...Ch. B.1 - Prob. 6ECh. B.1 - Prob. 7ECh. B.1 - In each of Exercises B.5B.14, a. decide whether...Ch. B.1 - In each of Exercises B.5B.14, a. decide whether...Ch. B.1 - In each of Exercises B.5B.14, a. decide whether...
Ch. B.1 - In each of Exercises B.5B.14, a. decide whether...Ch. B.1 - Prob. 12ECh. B.1 - In each of Exercises B.5B.14, a. decide whether...Ch. B.1 - In each of Exercises B.5B.14, a. decide whether...Ch. B.1 - Consider the scatterplot of y versus x in Output...Ch. B.1 - Consider the scatterplot of y versus x in Output...Ch. B.1 - Prob. 17ECh. B.1 - Prob. 18ECh. B.1 - If one or both of the assumptions of...Ch. B.1 - Prob. 20ECh. B.1 - Prob. 21ECh. B.1 - Prob. 22ECh. B.1 - Prob. 23ECh. B.1 - Gasoline Mileage Ratings. Gasoline mileage and...Ch. B.1 - Hip Fracture Rates. In the paper Very Low Rates of...Ch. B.1 - Prob. 26ECh. B.1 - Prob. 27ECh. B.1 - Prob. 28ECh. B.1 - Prob. 29ECh. B.1 - Gasoline Mileage Ratings. Refer to Exercise B.24,...Ch. B.1 - Hip Fracture Rates. Refer to Exercise B.25, where...Ch. B.1 - Drosophila Life-span. In the paper Extended...Ch. B.1 - Protein Content of Wheat. In their text, Methods...Ch. B.1 - Pine Tree Volume. Table B.2 on page B-5 provides...Ch. B.2 - Give an example of a. a second-degree polynomial...Ch. B.2 - In the polynomial regression equation y = 8 + 3x ...Ch. B.2 - Answer true or false to each of the following...Ch. B.2 - Explain why it is difficult to interpret the...Ch. B.2 - Fill in the blanks. a. A predictor variable is...Ch. B.2 - Answer true or false to each of the following...Ch. B.2 - Refer to the scatterplots in Outputs B.32(a) and...Ch. B.2 - Fill in the blanks. a. In the _______ method for...Ch. B.2 - Answer true or false to each of the following...Ch. B.2 - Stopping Distance. In their text Methods of...Ch. B.2 - Hour of Birth. In the paper increased Frequency of...Ch. B.2 - Silica Gel. Silica gel is a substance that absorbs...Ch. B.2 - Note: The data for the Using Technology exercises...Ch. B.2 - Hour of Birth. Refer to Exercise B.45, where the...Ch. B.2 - Silica Gel. Refer to Exercise B.46, where the...Ch. B.2 - Gasoline Mileage Ratings. Refer to Exercise B.24...Ch. B.2 - Protein Content of Wheat. Refer to Exercise B.33...Ch. B.2 - Satellite Orbits. Each issue of the magazine Ad...Ch. B.2 - Pine Tree Volume. In Example B.6 on page B-4, we...Ch. B.3 - Explain the difference between a quantitative...Ch. B.3 - In predicting a person's income, identify two...Ch. B.3 - In predicting the change in blood pressure for...Ch. B.3 - Fill in the blanks. a. A ___ predictor variable is...Ch. B.3 - Prob. 59ECh. B.3 - Answer true or false to each of the following...Ch. B.3 - For the regression equation y = 15 + 2x1 + 4x2 ...Ch. B.3 - Refer to Exercise B.61: a. Do the slopes of the...Ch. B.3 - Consider the regression equation y = 0 + 1 x1+ 2x2...Ch. B.3 - Prob. 64ECh. B.3 - Prob. 65ECh. B.3 - Prob. 66ECh. B.3 - Home Sale Prices. Refer to Example B.18 on page...Ch. B.3 - Mental Tasks and Drugs. In the text Statistical...Ch. B.3 - Gasoline Mileage Ratings. Refer to Exercise B.66...Ch. B.3 - Home Sale Prices. Refer to Exercise B.67 regarding...Ch. B.3 - Mental Tasks and Drugs. Refer to Exercise B.68...Ch. B.3 - Hip Fracture Rates. Refer to Exercise B.25 on page...Ch. B.3 - Television Viewing. The results of a study on...Ch. B.3 - Glue Strength. In the text Quality Control and...Ch. B.4 - Explain why the interpretation of the regression...Ch. B.4 - Answer true or false to each of the following...Ch. B.4 - Explain what is meant by multicollinearity.Ch. B.4 - Fill in the blanks. a. Consider a regression model...Ch. B.4 - Prob. 79ECh. B.4 - Prob. 80ECh. B.4 - Fill in the blanks. a. If predictor variable x1...Ch. B.4 - Answer true or false to each of the following...Ch. B.4 - State four ways to detect the presence of...Ch. B.4 - Prob. 84ECh. B.4 - Prob. 85ECh. B.4 - Prob. 86ECh. B.4 - Prob. 87ECh. B.4 - Prob. 88ECh. B.4 - Graduation Rates. Refer to Exercise B.86, where we...Ch. B.4 - Prob. 90ECh. B.4 - Gasoline Mileage Ratings. Refer to Exercise B.84,...Ch. B.4 - Graduation Rules. Refer to Exercise B.86, where we...Ch. B.5 - Explain what is meant by the variable selection...Ch. B.5 - Prob. 94ECh. B.5 - Fill in the blanks. a. In the forward selection...Ch. B.5 - Prob. 96ECh. B.5 - Answer true or false to each of the following...Ch. B.5 - Prob. 98ECh. B.5 - Prob. 99ECh. B.5 - Prob. 100ECh. B.5 - Prob. 101ECh. B.5 - Suppose that x1, x2, x3, and x4 are predictor...Ch. B.5 - Prob. 103ECh. B.5 - Graduation Rates. Refer to Exercise B.92 on page...Ch. B.5 - Home Sale Prices. In Example B. 18 on page B-67,...Ch. B.5 - Home Sale Prices. In Example B.18 on page B-67, we...Ch. B.5 - Infant Mortality Rates. In the article Children's...Ch. B.6 - Consider a multiple linear regression relating the...Ch. B.6 - Prob. 109ECh. B.6 - Prob. 110ECh. B.6 - Answer true or false to each of the following...Ch. B.6 - Explain the similarities and differences between...Ch. B.6 - Fill in the blanks. a. In the Mallows Cp...Ch. B.6 - Answer true or false to each of the following...Ch. B.6 - Gasoline Mileage Ratings. Refer to Exercise B.84...Ch. B.6 - Advertising and Sales. Refer to Exercise B.85 on...Ch. B.6 - Graduation Rates. Refer to Exercise B.86 on page...Ch. B.6 - Suppose that x1, x2, x3, and x4 are predictor...Ch. B.6 - Suppose that x1 x2, x3, and x4 are predictor...Ch. B.6 - Gasoline Mileage Ratings. Refer to Exercise B.91...Ch. B.6 - Graduation Rates. Refer to Exercise B.92 on page...Ch. B.6 - Home Sale Prices. Refer to Exercise B.105 on page...Ch. B.6 - Body Fat. Refer to Exercise B.106 on page B-143,...Ch. B.6 - Infant Mortality Rates. Refer to Exercise B.107 on...Ch. B.7 - List six problems that can arise in the collection...Ch. B.7 - Prob. 126ECh. B.7 - Prob. 127ECh. B.7 - Give an example of how a nonrepresentative sample...Ch. B.7 - Discuss the effect on a regression analysis of not...Ch. B.7 - Explain how multicollinearity can adversely affect...Ch. B.7 - Briefly describe what is meant by the problem of...Ch. B.7 - Answer true or false to each of the following...Ch. B.7 - Prob. 133ECh. B.7 - Discuss the advantages of using data collected...Ch. B.7 - Describe the potential effects of outliers on...Ch. B.7 - Prob. 136ECh. B.7 - Regarding regression analysis: a. What assumptions...Ch. B.7 - Answer true or false to each of the following...Ch. B.7 - Answer true or false to each of the following...Ch. B.7 - Discuss what G. E. P. Box might have meant when he...Ch. B.7 - Regarding model validation in regression: a. What...Ch. B - Explain what is meant when we say that a nonlinear...Ch. B - Answer true or false to the following statements...Ch. B - Prob. 3RPCh. B - Prob. 4RPCh. B - Answer true or false to each of the following...Ch. B - Paper Strength. In their text, Introduction to...Ch. B - Answer true or false to each of the following...Ch. B - Prob. 8RPCh. B - Explain what is meant when we say that a...Ch. B - OUTPUT B.95 Output for Problem 10 Regression...Ch. B - In regressing a response variable on several...Ch. B - Answer true or false to each of the following...Ch. B - Fill in the blanks. a. Multicollinearity is...Ch. B - Prob. 14RPCh. B - Explain why selecting a regression equation using...Ch. B - Answer true or false to each of the following...Ch. B - Fill in the blanks. a. In the _____ method, we...Ch. B - Patent Production. In the report The State New...Ch. B - Prob. 19RPCh. B - Prob. 20RPCh. B - Patent Production. Refer to Problem 18. where we...Ch. B - Prob. 22RPCh. B - Prob. 23RPCh. B - What are the possible consequences of the presence...Ch. B - Windmill Output. Refer to Problem 3, where we...Ch. B - Paper Strength. Refer to Problem 6, where we...Ch. B - Diabetes. Refer to Problem 10, where we considered...Ch. B - Hospital Stalling. Refer to Problem 14, where we...Ch. B - Patent Production. Refer to Problem 18, where we...Ch. B - Patent Production. Refer to Problem 29, where we...Ch. B - Recall from Chapter 1 of your text that the Focus...Ch. B - At the beginning of this module on page B-l, we...
Knowledge Booster


Learn more about
Need a deep-dive on the concept behind this application? Look no further. Learn more about this topic, statistics and related others by exploring similar questions and additional content below.Similar questions
- In a company with 80 employees, 60 earn $10.00 per hour and 20 earn $13.00 per hour. Is this average hourly wage considered representative?arrow_forwardThe following is a list of questions answered correctly on an exam. Calculate the Measures of Central Tendency from the ungrouped data list. NUMBER OF QUESTIONS ANSWERED CORRECTLY ON AN APTITUDE EXAM 112 72 69 97 107 73 92 76 86 73 126 128 118 127 124 82 104 132 134 83 92 108 96 100 92 115 76 91 102 81 95 141 81 80 106 84 119 113 98 75 68 98 115 106 95 100 85 94 106 119arrow_forwardThe following ordered data list shows the data speeds for cell phones used by a telephone company at an airport: A. Calculate the Measures of Central Tendency using the table in point B. B. Are there differences in the measurements obtained in A and C? Why (give at least one justified reason)? 0.8 1.4 1.8 1.9 3.2 3.6 4.5 4.5 4.6 6.2 6.5 7.7 7.9 9.9 10.2 10.3 10.9 11.1 11.1 11.6 11.8 12.0 13.1 13.5 13.7 14.1 14.2 14.7 15.0 15.1 15.5 15.8 16.0 17.5 18.2 20.2 21.1 21.5 22.2 22.4 23.1 24.5 25.7 28.5 34.6 38.5 43.0 55.6 71.3 77.8arrow_forward
- In a company with 80 employees, 60 earn $10.00 per hour and 20 earn $13.00 per hour. a) Determine the average hourly wage. b) In part a), is the same answer obtained if the 60 employees have an average wage of $10.00 per hour? Prove your answer.arrow_forwardThe following ordered data list shows the data speeds for cell phones used by a telephone company at an airport: A. Calculate the Measures of Central Tendency from the ungrouped data list. B. Group the data in an appropriate frequency table. 0.8 1.4 1.8 1.9 3.2 3.6 4.5 4.5 4.6 6.2 6.5 7.7 7.9 9.9 10.2 10.3 10.9 11.1 11.1 11.6 11.8 12.0 13.1 13.5 13.7 14.1 14.2 14.7 15.0 15.1 15.5 15.8 16.0 17.5 18.2 20.2 21.1 21.5 22.2 22.4 23.1 24.5 25.7 28.5 34.6 38.5 43.0 55.6 71.3 77.8arrow_forwardBusinessarrow_forward
- https://www.hawkeslearning.com/Statistics/dbs2/datasets.htmlarrow_forwardNC Current Students - North Ce X | NC Canvas Login Links - North ( X Final Exam Comprehensive x Cengage Learning x WASTAT - Final Exam - STAT → C webassign.net/web/Student/Assignment-Responses/submit?dep=36055360&tags=autosave#question3659890_9 Part (b) Draw a scatter plot of the ordered pairs. N Life Expectancy Life Expectancy 80 70 600 50 40 30 20 10 Year of 1950 1970 1990 2010 Birth O Life Expectancy Part (c) 800 70 60 50 40 30 20 10 1950 1970 1990 W ALT 林 $ # 4 R J7 Year of 2010 Birth F6 4+ 80 70 60 50 40 30 20 10 Year of 1950 1970 1990 2010 Birth Life Expectancy Ox 800 70 60 50 40 30 20 10 Year of 1950 1970 1990 2010 Birth hp P.B. KA & 7 80 % 5 H A B F10 711 N M K 744 PRT SC ALT CTRLarrow_forwardHarvard University California Institute of Technology Massachusetts Institute of Technology Stanford University Princeton University University of Cambridge University of Oxford University of California, Berkeley Imperial College London Yale University University of California, Los Angeles University of Chicago Johns Hopkins University Cornell University ETH Zurich University of Michigan University of Toronto Columbia University University of Pennsylvania Carnegie Mellon University University of Hong Kong University College London University of Washington Duke University Northwestern University University of Tokyo Georgia Institute of Technology Pohang University of Science and Technology University of California, Santa Barbara University of British Columbia University of North Carolina at Chapel Hill University of California, San Diego University of Illinois at Urbana-Champaign National University of Singapore McGill…arrow_forward
- Name Harvard University California Institute of Technology Massachusetts Institute of Technology Stanford University Princeton University University of Cambridge University of Oxford University of California, Berkeley Imperial College London Yale University University of California, Los Angeles University of Chicago Johns Hopkins University Cornell University ETH Zurich University of Michigan University of Toronto Columbia University University of Pennsylvania Carnegie Mellon University University of Hong Kong University College London University of Washington Duke University Northwestern University University of Tokyo Georgia Institute of Technology Pohang University of Science and Technology University of California, Santa Barbara University of British Columbia University of North Carolina at Chapel Hill University of California, San Diego University of Illinois at Urbana-Champaign National University of Singapore…arrow_forwardA company found that the daily sales revenue of its flagship product follows a normal distribution with a mean of $4500 and a standard deviation of $450. The company defines a "high-sales day" that is, any day with sales exceeding $4800. please provide a step by step on how to get the answers in excel Q: What percentage of days can the company expect to have "high-sales days" or sales greater than $4800? Q: What is the sales revenue threshold for the bottom 10% of days? (please note that 10% refers to the probability/area under bell curve towards the lower tail of bell curve) Provide answers in the yellow cellsarrow_forwardFind the critical value for a left-tailed test using the F distribution with a 0.025, degrees of freedom in the numerator=12, and degrees of freedom in the denominator = 50. A portion of the table of critical values of the F-distribution is provided. Click the icon to view the partial table of critical values of the F-distribution. What is the critical value? (Round to two decimal places as needed.)arrow_forward
arrow_back_ios
SEE MORE QUESTIONS
arrow_forward_ios
Recommended textbooks for you

 Elementary Linear Algebra (MindTap Course List)AlgebraISBN:9781305658004Author:Ron LarsonPublisher:Cengage Learning
 Functions and Change: A Modeling Approach to Coll...AlgebraISBN:9781337111348Author:Bruce Crauder, Benny Evans, Alan NoellPublisher:Cengage Learning
 Algebra & Trigonometry with Analytic GeometryAlgebraISBN:9781133382119Author:SwokowskiPublisher:Cengage
 Holt Mcdougal Larson Pre-algebra: Student Edition...AlgebraISBN:9780547587776Author:HOLT MCDOUGALPublisher:HOLT MCDOUGAL
Elementary Linear Algebra (MindTap Course List)
Algebra
ISBN:9781305658004
Author:Ron Larson
Publisher:Cengage Learning
Functions and Change: A Modeling Approach to Coll...
Algebra
ISBN:9781337111348
Author:Bruce Crauder, Benny Evans, Alan Noell
Publisher:Cengage Learning
Algebra & Trigonometry with Analytic Geometry
Algebra
ISBN:9781133382119
Author:Swokowski
Publisher:Cengage
Holt Mcdougal Larson Pre-algebra: Student Edition...
Algebra
ISBN:9780547587776
Author:HOLT MCDOUGAL
Publisher:HOLT MCDOUGAL
Correlation Vs Regression: Difference Between them with definition & Comparison Chart; Author: Key Differences;https://www.youtube.com/watch?v=Ou2QGSJVd0U;License: Standard YouTube License, CC-BY
Correlation and Regression: Concepts with Illustrative examples; Author: LEARN & APPLY : Lean and Six Sigma;https://www.youtube.com/watch?v=xTpHD5WLuoA;License: Standard YouTube License, CC-BY