Concept explainers
Videos
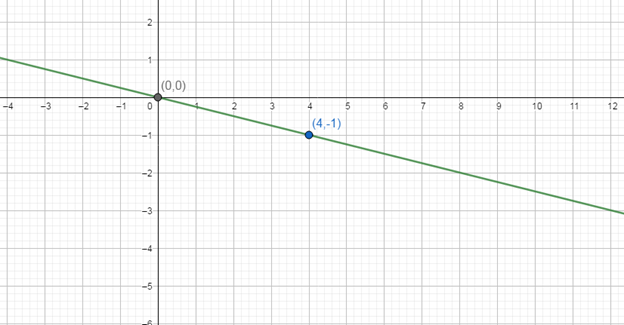
To graph the equation using slope and y-intercept.
Explanation of Solution
Given information:
The given equation is:
Graph:
The equation is written as:
The slope of the equation is
Graph the y-intercept at
Using the slope
Move
The other point is
Draw a line through the two points.
The graph is:
Chapter 9 Solutions
Glencoe Math Accelerated, Student Edition
Additional Math Textbook Solutions
Intro Stats, Books a la Carte Edition (5th Edition)
Calculus: Early Transcendentals (2nd Edition)
A First Course in Probability (10th Edition)
Introductory Statistics
Pre-Algebra Student Edition


- 1. Estimate the area under the graph of f(x)-25-x from x=0 to x=5 using 5 approximating rectangles Using: (A) right endpoints. (B) left endpoints.arrow_forward9. Use fundamental theorem of calculus to find the derivative d a) *dt sin(x) b)(x)√1-2 dtarrow_forward3. Evaluate the definite integral: a) √66x²+8dx b) x dx c) f*(2e* - 2)dx d) √√9-x² e) (2-5x)dx f) cos(x)dx 8)²₁₂√4-x2 h) f7dx i) f² 6xdx j) ²₂(4x+3)dxarrow_forward
- 2. Consider the integral √(2x+1)dx (a) Find the Riemann sum for this integral using right endpoints and n-4. (b) Find the Riemann sum for this same integral, using left endpoints and n=4arrow_forward5. For the function y-x³-3x²-1, use derivatives to: (a) determine the intervals of increase and decrease. (b) determine the local (relative) maxima and minima. (e) determine the intervals of concavity. (d) determine the points of inflection. (e) sketch the graph with the above information indicated on the graph.arrow_forwardProblem 11 (a) A tank is discharging water through an orifice at a depth of T meter below the surface of the water whose area is A m². The following are the values of a for the corresponding values of A: A 1.257 1.390 x 1.50 1.65 1.520 1.650 1.809 1.962 2.123 2.295 2.462|2.650 1.80 1.95 2.10 2.25 2.40 2.55 2.70 2.85 Using the formula -3.0 (0.018)T = dx. calculate T, the time in seconds for the level of the water to drop from 3.0 m to 1.5 m above the orifice. (b) The velocity of a train which starts from rest is given by the fol- lowing table, the time being reckoned in minutes from the start and the speed in km/hour: | † (minutes) |2|4 6 8 10 12 14 16 18 20 v (km/hr) 16 28.8 40 46.4 51.2 32.0 17.6 8 3.2 0 Estimate approximately the total distance ran in 20 minutes.arrow_forward
- 8–23. Sketching vector fields Sketch the following vector fieldsarrow_forward25-30. Normal and tangential components For the vector field F and curve C, complete the following: a. Determine the points (if any) along the curve C at which the vector field F is tangent to C. b. Determine the points (if any) along the curve C at which the vector field F is normal to C. c. Sketch C and a few representative vectors of F on C. 25. F = (2½³, 0); c = {(x, y); y − x² = 1} 26. F = x (23 - 212) ; C = {(x, y); y = x² = 1}) , 2 27. F(x, y); C = {(x, y): x² + y² = 4} 28. F = (y, x); C = {(x, y): x² + y² = 1} 29. F = (x, y); C = 30. F = (y, x); C = {(x, y): x = 1} {(x, y): x² + y² = 1}arrow_forward٣/١ B msl kd 180 Ka, Sin (1) I sin () sin(30) Sin (30) اذا ميريد شرح الكتب بس 0 بالفراغ 3) Cos (30) 0.866 4) Rotating 5) Synchronous speed, 120 x 50 G 5005 1000 s = 1000-950 Copper bosses 5kW Rotor input 5 0.05 : loo kw 6) 1 /0001 ined sove in peaper I need a detailed solution on paper please وه اذا ميريد شرح الكتب فقط ١٥٠ DC 7) rotor a ' (y+xlny + xe*)dx + (xsiny + xlnx + dy = 0. Q1// Find the solution of: ( 357arrow_forward
 Calculus: Early TranscendentalsCalculusISBN:9781285741550Author:James StewartPublisher:Cengage Learning
 Thomas' Calculus (14th Edition)CalculusISBN:9780134438986Author:Joel R. Hass, Christopher E. Heil, Maurice D. WeirPublisher:PEARSON
 Calculus: Early Transcendentals (3rd Edition)CalculusISBN:9780134763644Author:William L. Briggs, Lyle Cochran, Bernard Gillett, Eric SchulzPublisher:PEARSON
 Calculus: Early TranscendentalsCalculusISBN:9781319050740Author:Jon Rogawski, Colin Adams, Robert FranzosaPublisher:W. H. Freeman
 Calculus: Early Transcendental FunctionsCalculusISBN:9781337552516Author:Ron Larson, Bruce H. EdwardsPublisher:Cengage Learning