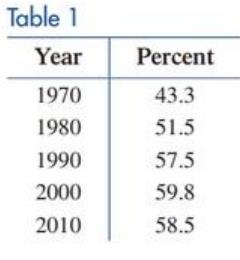
Labor force. Table 1 gives the percentage of the U.S. female population who were members of the civilian labor force in the indicated years. The following transition matrix
(A) Let
(B) Construct a new table comparing the results from part (A) with the data in Table 1.
(C) According to this transition matrix, what percentage of the U.S. female population will be in the labor force in the long run?

Want to see the full answer?
Check out a sample textbook solution
Chapter 9 Solutions
Pearson eText for Finite Mathematics for Business, Economics, Life Sciences, and Social Sciences -- Instant Access (Pearson+)
Additional Math Textbook Solutions
Thinking Mathematically (6th Edition)
Algebra and Trigonometry (6th Edition)
Calculus: Early Transcendentals (2nd Edition)
Basic Business Statistics, Student Value Edition
A First Course in Probability (10th Edition)
Elementary Statistics (13th Edition)
- 3.1 Limits 1. If lim f(x)=-6 and lim f(x)=5, then lim f(x). Explain your choice. x+3° x+3* x+3 (a) Is 5 (c) Does not exist (b) is 6 (d) is infinitearrow_forward1 pts Let F and G be vector fields such that ▼ × F(0, 0, 0) = (0.76, -9.78, 3.29), G(0, 0, 0) = (−3.99, 6.15, 2.94), and G is irrotational. Then sin(5V (F × G)) at (0, 0, 0) is Question 1 -0.246 0.072 -0.934 0.478 -0.914 -0.855 0.710 0.262 .arrow_forwardAnswer the number questions with the following answers +/- 2 sqrt(2) +/- i sqrt(6) (-3 +/-3 i sqrt(3))/4 +/-1 +/- sqrt(6) +/- 2/3 sqrt(3) 4 -3 +/- 3 i sqrt(3)arrow_forward
- 2. Answer the following questions. (A) [50%] Given the vector field F(x, y, z) = (x²y, e", yz²), verify the differential identity Vx (VF) V(V •F) - V²F (B) [50%] Remark. You are confined to use the differential identities. Let u and v be scalar fields, and F be a vector field given by F = (Vu) x (Vv) (i) Show that F is solenoidal (or incompressible). (ii) Show that G = (uvv – vVu) is a vector potential for F.arrow_forwardA driver is traveling along a straight road when a buffalo runs into the street. This driver has a reaction time of 0.75 seconds. When the driver sees the buffalo he is traveling at 44 ft/s, his car can decelerate at 2 ft/s^2 when the brakes are applied. What is the stopping distance between when the driver first saw the buffalo, to when the car stops.arrow_forwardTopic 2 Evaluate S x dx, using u-substitution. Then find the integral using 1-x2 trigonometric substitution. Discuss the results! Topic 3 Explain what an elementary anti-derivative is. Then consider the following ex integrals: fed dx x 1 Sdx In x Joseph Liouville proved that the first integral does not have an elementary anti- derivative Use this fact to prove that the second integral does not have an elementary anti-derivative. (hint: use an appropriate u-substitution!)arrow_forward
- 1. Given the vector field F(x, y, z) = -xi, verify the relation 1 V.F(0,0,0) = lim 0+ volume inside Se ff F• Nds SE where SE is the surface enclosing a cube centred at the origin and having edges of length 2€. Then, determine if the origin is sink or source.arrow_forward4 3 2 -5 4-3 -2 -1 1 2 3 4 5 12 23 -4 The function graphed above is: Increasing on the interval(s) Decreasing on the interval(s)arrow_forwardQuestion 4 The plot below represents the function f(x) 8 7 3 pts O -4-3-2-1 6 5 4 3 2 + 1 2 3 5 -2+ Evaluate f(3) f(3) = Solve f(x) = 3 x= Question 5arrow_forward
- Question 14 6+ 5 4 3 2 -8-2 2 3 4 5 6 + 2 3 4 -5 -6 The graph above is a transformation of the function f(x) = |x| Write an equation for the function graphed above g(x) =arrow_forwardQuestion 8 Use the graph of f to evaluate the following: 6 f(x) 5 4 3 2 1 -1 1 2 3 4 5 -1 t The average rate of change of f from 4 to 5 = Question 9 10 ☑ 4parrow_forwardQuestion 15 ✓ 6 pts 1 Details The function shown below is f(x). We are interested in the transformed function g(x) = 3f(2x) - 1 a) Describe all the transformations g(x) has made to f(x) (shifts, stretches, etc). b) NEATLY sketch the transformed function g(x) and upload your graph as a PDF document below. You may use graph paper if you want. Be sure to label your vertical and horizontal scales so that I can tell how big your function is. 1- 0 2 3 4 -1- Choose File No file chosen Question 16 0 pts 1 Detailsarrow_forward
 Big Ideas Math A Bridge To Success Algebra 1: Stu...AlgebraISBN:9781680331141Author:HOUGHTON MIFFLIN HARCOURTPublisher:Houghton Mifflin Harcourt
 Functions and Change: A Modeling Approach to Coll...AlgebraISBN:9781337111348Author:Bruce Crauder, Benny Evans, Alan NoellPublisher:Cengage Learning
 Linear Algebra: A Modern IntroductionAlgebraISBN:9781285463247Author:David PoolePublisher:Cengage Learning
 Glencoe Algebra 1, Student Edition, 9780079039897...AlgebraISBN:9780079039897Author:CarterPublisher:McGraw Hill
 College AlgebraAlgebraISBN:9781305115545Author:James Stewart, Lothar Redlin, Saleem WatsonPublisher:Cengage Learning


