
Statistics for Engineers and Scientists
4th Edition
ISBN: 9780073401331
Author: William Navidi Prof.
Publisher: McGraw-Hill Education
expand_more
expand_more
format_list_bulleted
Concept explainers
Videos
Textbook Question
Chapter 9.1, Problem 1E
A study is made of the effect of curing temperature on the compressive strength of a certain type of concrete. Five concrete specimens are cured at each of four temperatures, and the compressive strength of each specimen is measured (in MPa). The results are as follows:
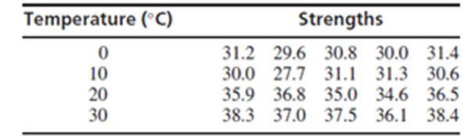
- a. Construct an ANOVA table. You may give a
range for the P-value. - b. Can you conclude that the
mean strength differs with temperature?
Expert Solution & Answer
Want to see the full answer?
Check out a sample textbook solution
Students have asked these similar questions
Find the critical value for a left-tailed test using the F distribution with a 0.025, degrees of freedom in the numerator=12, and degrees of freedom in the
denominator = 50. A portion of the table of critical values of the F-distribution is provided.
Click the icon to view the partial table of critical values of the F-distribution.
What is the critical value?
(Round to two decimal places as needed.)
A retail store manager claims that the average daily sales of the store are $1,500.
You aim to test whether the actual average daily sales differ significantly from this claimed value.
You can provide your answer by inserting a text box and the answer must include:
Null hypothesis,
Alternative hypothesis,
Show answer (output table/summary table), and
Conclusion based on the P value.
Showing the calculation is a must. If calculation is missing,so please provide a step by step on the answers
Numerical answers in the yellow cells
Show all work
Chapter 9 Solutions
Statistics for Engineers and Scientists
Ch. 9.1 - A study is made of the effect of curing...Ch. 9.1 - The article Nutrient Deprivation Improves Field...Ch. 9.1 - Prob. 3ECh. 9.1 - The antibiotic gentamicin sulphate is often...Ch. 9.1 - The article influence of Age on Masonry Bond...Ch. 9.1 - Archaeologists can determine the diets of ancient...Ch. 9.1 - The article Secretion of Parathyroid Hormone...Ch. 9.1 - The article Impact of Free Calcium Oxide Content...Ch. 9.1 - A certain chemical reaction was run three times at...Ch. 9.1 - An experiment to compare the lifetimes of four...
Ch. 9.1 - Prob. 11ECh. 9.1 - Prob. 12ECh. 9.1 - Prob. 13ECh. 9.1 - Prob. 14ECh. 9.1 - Refer to Exercise 12. a. Compute the quantity...Ch. 9.1 - Prob. 16ECh. 9.1 - Prob. 17ECh. 9.1 - Prob. 18ECh. 9.1 - Prob. 19ECh. 9.1 - The following MINITAB output presents a power...Ch. 9.2 - Exercises for Section 9.2 1.The article Organic...Ch. 9.2 - The article Optimum Design of an A-pillar Trim...Ch. 9.2 - Prob. 3ECh. 9.2 - Refer to Exercise 2 in Section 9.1. a.Use the...Ch. 9.2 - Refer to Exercise 13 in Section 9.1. a. Use the...Ch. 9.2 - Refer to Exercise 1 in Section 9.1. A scientist...Ch. 9.2 - Refer to Exercise 13 in Section 9.1. A...Ch. 9.2 - Refer to Exercise 3 in Section 9.1. a. Use the...Ch. 9.2 - Refer to Exercise 5 in Section 9.1. a. Use the...Ch. 9.2 - Refer to Exercise 9 in Section 9.1. a. Use the...Ch. 9.2 - Refer to Exercise 16 in Section 9.1. a. Use the...Ch. 9.2 - Refer to Exercise 18 in Section 9.1. a. Use the...Ch. 9.2 - In an experiment to determine the effect of...Ch. 9.2 - In an experiment to determine the effect of curing...Ch. 9.2 - Prob. 15ECh. 9.2 - For some data sets, the F statistic will reject...Ch. 9.3 - To assess the effect of piston ring type and oil...Ch. 9.3 - A machine shop has three machines used in...Ch. 9.3 - An experiment to determine the effect of mold...Ch. 9.3 - The effect of curing pressure on bond strength was...Ch. 9.3 - The article Change in Creep Behavior of Plexiform...Ch. 9.3 - Prob. 6ECh. 9.3 - Prob. 7ECh. 9.3 - Adding glass panicles to clay brick may improve...Ch. 9.3 - The article Application of Radial Basis Function...Ch. 9.3 - Prob. 10ECh. 9.3 - Prob. 11ECh. 9.3 - The article Anodic Fenton Treatment of Treflan MTF...Ch. 9.3 - Refer to Exercise 12. The treatments with a...Ch. 9.3 - The article Use of Taguchi Methods and Multiple...Ch. 9.3 - The article T-Bracing for Stability of Compression...Ch. 9.3 - The article referred to in Exercise 15 also...Ch. 9.3 - Prob. 17ECh. 9.3 - Prob. 18ECh. 9.3 - The article Cellulose Acetate Microspheres...Ch. 9.4 - Recycling newsprint is important in reducing...Ch. 9.4 - A study was done to see which of four machines is...Ch. 9.4 - Prob. 3ECh. 9.4 - Three different corrosion-resistant coatings are...Ch. 9.4 - The article Genotype-Environment Interactions and...Ch. 9.4 - The article Sprinkler Technologies, Soil...Ch. 9.4 - The article Bromate Surveys in French Drinking...Ch. 9.4 - The article Multi-objective Scheduling Problems:...Ch. 9.4 - You have been given the task of designing a study...Ch. 9.4 - An engineering professor wants to determine which...Ch. 9.5 - Prob. 1ECh. 9.5 - Give an example of a factorial experiment in which...Ch. 9.5 - Prob. 3ECh. 9.5 - The article Efficient Pyruvate Production by a...Ch. 9.5 - The article cited in Exercise 4 also investigated...Ch. 9.5 - A metal casting process for the production of...Ch. 9.5 - The article An Investigation into the Ball...Ch. 9.5 - In a 2p design with one replicate per treatment,...Ch. 9.5 - Prob. 9ECh. 9.5 - Prob. 10ECh. 9.5 - The article Factorial Design for Column Rotation...Ch. 9.5 - Prob. 12ECh. 9.5 - Prob. 13ECh. 9 - The article Gypsum Effect on the Aggregate Size...Ch. 9 - Prob. 2SECh. 9 - Prob. 3SECh. 9 - Prob. 4SECh. 9 - Prob. 5SECh. 9 - Prob. 6SECh. 9 - Prob. 7SECh. 9 - The article Case Study Based Instruction of DOE...Ch. 9 - The article Combined Analysis of Real-Time...Ch. 9 - Vermont maple sugar producers sponsored a testing...Ch. 9 - Prob. 11SECh. 9 - Prob. 12SECh. 9 - Prob. 13SECh. 9 - The article Enthalpies and Entropies of Transfer...Ch. 9 - Prob. 15SECh. 9 - Prob. 16SECh. 9 - The article Factorial Experiments in the...Ch. 9 - The Williamsburg Bridge is a suspension bridge...Ch. 9 - Prob. 19SECh. 9 - In the article Nitrate Contamination of Alluvial...Ch. 9 - The article Factorial Experiments in the...Ch. 9 - Prob. 22SECh. 9 - Prob. 23SECh. 9 - Prob. 24SE
Additional Math Textbook Solutions
Find more solutions based on key concepts
For Problems 23-28, write in simpler form, as in Example 4. logbFG
Finite Mathematics for Business, Economics, Life Sciences and Social Sciences
Provide an example of a qualitative variable and an example of a quantitative variable.
Elementary Statistics ( 3rd International Edition ) Isbn:9781260092561
NOTE: Write your answers using interval notation when appropriate.
CHECKING ANALYTIC SKILLS Fill in each blank ...
Graphical Approach To College Algebra
153. A rain gutter is made from sheets of aluminum that are 20 inches wide. As shown in the figure, the edges ...
College Algebra (7th Edition)
The first derivative of function y=25x4.
Calculus for Business, Economics, Life Sciences, and Social Sciences (14th Edition)
(a) Make a stem-and-leaf plot for these 24 observations on the number of customers who used a down-town CitiBan...
APPLIED STAT.IN BUS.+ECONOMICS
Knowledge Booster


Learn more about
Need a deep-dive on the concept behind this application? Look no further. Learn more about this topic, statistics and related others by exploring similar questions and additional content below.Similar questions
- Show all workarrow_forwardplease find the answers for the yellows boxes using the information and the picture belowarrow_forwardA marketing agency wants to determine whether different advertising platforms generate significantly different levels of customer engagement. The agency measures the average number of daily clicks on ads for three platforms: Social Media, Search Engines, and Email Campaigns. The agency collects data on daily clicks for each platform over a 10-day period and wants to test whether there is a statistically significant difference in the mean number of daily clicks among these platforms. Conduct ANOVA test. You can provide your answer by inserting a text box and the answer must include: also please provide a step by on getting the answers in excel Null hypothesis, Alternative hypothesis, Show answer (output table/summary table), and Conclusion based on the P value.arrow_forward
- A company found that the daily sales revenue of its flagship product follows a normal distribution with a mean of $4500 and a standard deviation of $450. The company defines a "high-sales day" that is, any day with sales exceeding $4800. please provide a step by step on how to get the answers Q: What percentage of days can the company expect to have "high-sales days" or sales greater than $4800? Q: What is the sales revenue threshold for the bottom 10% of days? (please note that 10% refers to the probability/area under bell curve towards the lower tail of bell curve) Provide answers in the yellow cellsarrow_forwardBusiness Discussarrow_forwardThe following data represent total ventilation measured in liters of air per minute per square meter of body area for two independent (and randomly chosen) samples. Analyze these data using the appropriate non-parametric hypothesis testarrow_forward
arrow_back_ios
SEE MORE QUESTIONS
arrow_forward_ios
Recommended textbooks for you
 Glencoe Algebra 1, Student Edition, 9780079039897...AlgebraISBN:9780079039897Author:CarterPublisher:McGraw Hill
 Big Ideas Math A Bridge To Success Algebra 1: Stu...AlgebraISBN:9781680331141Author:HOUGHTON MIFFLIN HARCOURTPublisher:Houghton Mifflin Harcourt
Glencoe Algebra 1, Student Edition, 9780079039897...
Algebra
ISBN:9780079039897
Author:Carter
Publisher:McGraw Hill
Big Ideas Math A Bridge To Success Algebra 1: Stu...
Algebra
ISBN:9781680331141
Author:HOUGHTON MIFFLIN HARCOURT
Publisher:Houghton Mifflin Harcourt
Statistics 4.1 Point Estimators; Author: Dr. Jack L. Jackson II;https://www.youtube.com/watch?v=2MrI0J8XCEE;License: Standard YouTube License, CC-BY
Statistics 101: Point Estimators; Author: Brandon Foltz;https://www.youtube.com/watch?v=4v41z3HwLaM;License: Standard YouTube License, CC-BY
Central limit theorem; Author: 365 Data Science;https://www.youtube.com/watch?v=b5xQmk9veZ4;License: Standard YouTube License, CC-BY
Point Estimate Definition & Example; Author: Prof. Essa;https://www.youtube.com/watch?v=OTVwtvQmSn0;License: Standard Youtube License
Point Estimation; Author: Vamsidhar Ambatipudi;https://www.youtube.com/watch?v=flqhlM2bZWc;License: Standard Youtube License