
Concept explainers
Videos
For each exercise, perform these steps. Assume that all variables are normally or approximately
a. State the hypotheses and identify the claim.
b. Find the critical value(s).
c. Compute the test value.
d. Make the decision.
e. Summarize the results.
Use the traditional method of hypothesis testing unless otherwise specified.
5. Teachers’ Salaries A random sample of 15 teachers from Rhode Island has an average salary of $35,270, with a standard deviation of $3256. A random sample of 30 teachers from New York has an average salary of $29,512, with a standard deviation of $1432. Is there a significant difference in teachers’ salaries between the two states? Use α = 0.02. Find the 98% confidence interval for the difference of the two
a.
To identify: The claim and state
Answer to Problem 9.2.5RE
The claim is that “there is a significant difference in teachers’ salaries between the two states”.
The hypotheses are given below:
Null hypothesis:
Alternative hypothesis:
Explanation of Solution
Given info:
Justification:
Here, there is a significant difference in teachers’ salaries between the two states is tested. Hence, the claim is that there is a significant difference in teachers’ salaries between the two states. This can be written as
The hypotheses are given below:
Null hypothesis:
Alternative hypothesis:
b.
To find: The critical value
Answer to Problem 9.2.5RE
The critical value at
Explanation of Solution
Calculation:
Here, the test is two tailed test.
Critical value:
Here, variances are not equal. Hence, the degrees of freedom is,
Software Procedure:
Step-by-step procedure to obtain the critical value using the MINITAB software:
- Choose Graph > Probability Distribution Plot choose View Probability> OK.
- From Distribution, choose ‘t’ distribution.
- In Degrees of freedom, enter 14.
- Click the Shaded Area tab.
- Choose Probability value and Two Tail for the region of the curve to shade.
- Enter the Probability value as 0.02.
- Click OK.
Output using the MINITAB software is given below:
From the output, the critical value is
c.
To find: The test value.
To find: The 98% confidence interval for the difference of the two means.
Answer to Problem 9.2.5RE
The test value is –0.9.
The 98% confidence interval for the difference of the two means is
Explanation of Solution
Calculation:
Test statistic:
Software Procedure:
Step by step procedure to obtain test statistic using the MINITAB software:
- Choose Stat > Basic Statistics > 2-Sample t.
- Choose Summarized data.
- In first, enter Sample size as15, Mean as 35,270, Standard deviation as 3,256.
- In second, enter Sample size as30, Mean as 29,512, Standard deviation as 1,432.
- Choose Options.
- In Confidence level, enter 98.
- In Alternative, select not equal.
- Click OK in all the dialogue boxes.
Output using the MINITAB software is given below:
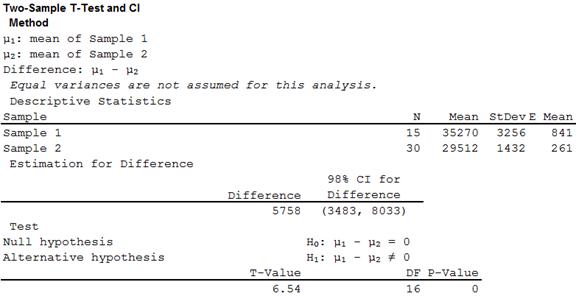
From the MINITAB output, the test value is 6.54 and the 98% confidence interval for the difference of the two means is
d.
To make: The decision.
Answer to Problem 9.2.5RE
The decision is that, the null hypothesis isrejected.
Explanation of Solution
Calculation:
Software Procedure:
Step-by-step procedure to indicate the appropriate area and critical value using the MINITAB software:
- Choose Graph > Probability Distribution Plot choose View Probability> OK.
- From Distribution, choose ‘t’ distribution.
- In Degrees of freedom, enter 8.
- Click the Shaded Area tab.
- Choose Probability value and Two Tail for the region of the curve to shade.
- Enter the Probability value as 0.02.
- Enter 6.54 under show reference lines at X values
- Click OK.
Output using the MINITAB software is given below:
From the output, it can be observed that the test statistic value falls in the critical region. Therefore, the null hypothesis isrejected.
e.
To summarize: The result.
Answer to Problem 9.2.5RE
The conclusion is that, there is enough evidence to support the claim that there is a significant difference in teachers’ salaries between the two states.
Explanation of Solution
Justification:
From part (d), the null hypothesis is rejected. Thus, there is enough evidence to support the claim that there is a significant difference in teachers’ salaries between the two states.
Want to see more full solutions like this?
Chapter 9 Solutions
ELEMENTARY STATISTICS: STEP BY STEP- ALE


- At the same restaurant as in Question 19 with the same normal distribution, what's the chance of it taking no more than 15 minutes to get service?arrow_forwardClint, obviously not in college, sleeps an average of 8 hours per night with a standard deviation of 15 minutes. What's the chance of him sleeping between 7.5 and 8.5 hours on any given night? 0-(7-0) 200 91109s and doiw $20 (8-0) mol 8520 slang $199 galbrog seam side pide & D (newid se od poyesvig as PELEO PER AFTE editiw noudab temand van Czarrow_forwardTimes to complete a statistics exam have a normal distribution with a mean of 40 minutes and standard deviation of 6 minutes. Deshawn's time comes in at the 90th percentile. What percentage of the students are still working on their exams when Deshawn leaves?arrow_forward
- Suppose that the weights of cereal boxes have a normal distribution with a mean of 20 ounces and standard deviation of half an ounce. A box that has a standard score of o weighs how much? syed by ilog ni 21arrow_forwardBob scores 80 on both his math exam (which has a mean of 70 and standard deviation of 10) and his English exam (which has a mean of 85 and standard deviation of 5). Find and interpret Bob's Z-scores on both exams to let him know which exam (if either) he did bet- ter on. Don't, however, let his parents know; let them think he's just as good at both subjects. algas 70) sering digarrow_forwardSue's math class exam has a mean of 70 with a standard deviation of 5. Her standard score is-2. What's her original exam score?arrow_forward
- Clint sleeps an average of 8 hours per night with a standard deviation of 15 minutes. What's the chance he will sleep less than 7.5 hours tonight? nut bow visarrow_forwardSuppose that your score on an exam is directly at the mean. What's your standard score?arrow_forwardOne state's annual rainfall has a normal dis- tribution with a mean of 100 inches and standard deviation of 25 inches. Suppose that corn grows best when the annual rainfall is between 100 and 150 inches. What's the chance of achieving this amount of rainfall? wved now of sociarrow_forward
 College Algebra (MindTap Course List)AlgebraISBN:9781305652231Author:R. David Gustafson, Jeff HughesPublisher:Cengage Learning
 Glencoe Algebra 1, Student Edition, 9780079039897...AlgebraISBN:9780079039897Author:CarterPublisher:McGraw Hill

 Holt Mcdougal Larson Pre-algebra: Student Edition...AlgebraISBN:9780547587776Author:HOLT MCDOUGALPublisher:HOLT MCDOUGAL