Televisions: CI (Example 14) Minitab output is shown for a two-sample t -interval for the number of televisions owned in households of random samples of students at two different community colleges. Each individual was randomly chosen independently of the others. One of the schools is in a wealthy community (MC), and the other (OC) is in a less wealthy community. a. Are the conditions for using a confidence interval for the difference between two means met? b. State the interval in a clear and correct sentence. c. Does the interval capture 0? Explain what that shows.
Televisions: CI (Example 14) Minitab output is shown for a two-sample t -interval for the number of televisions owned in households of random samples of students at two different community colleges. Each individual was randomly chosen independently of the others. One of the schools is in a wealthy community (MC), and the other (OC) is in a less wealthy community. a. Are the conditions for using a confidence interval for the difference between two means met? b. State the interval in a clear and correct sentence. c. Does the interval capture 0? Explain what that shows.
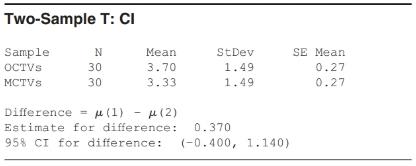
Solution Summary: The author explains how the Minitab output shows the confidence interval of the difference between the mean number of televisions owned by the wealthy community and the other community households.
Televisions: CI (Example 14) Minitab output is shown for a two-sample
t
-interval
for the number of televisions owned in households of random samples of students at two different community colleges. Each individual was randomly chosen independently of the others. One of the schools is in a wealthy community (MC), and the other (OC) is in a less wealthy community.
a. Are the conditions for using a confidence interval for the difference between two means met?
b. State the interval in a clear and correct sentence.
c. Does the interval capture 0? Explain what that shows.
Definition Definition Number of subjects or observations included in a study. A large sample size typically provides more reliable results and better representation of the population. As sample size and width of confidence interval are inversely related, if the sample size is increased, the width of the confidence interval decreases.
Find the critical value for a left-tailed test using the F distribution with a 0.025, degrees of freedom in the numerator=12, and degrees of freedom in the
denominator = 50. A portion of the table of critical values of the F-distribution is provided.
Click the icon to view the partial table of critical values of the F-distribution.
What is the critical value?
(Round to two decimal places as needed.)
A retail store manager claims that the average daily sales of the store are $1,500.
You aim to test whether the actual average daily sales differ significantly from this claimed value.
You can provide your answer by inserting a text box and the answer must include:
Null hypothesis,
Alternative hypothesis,
Show answer (output table/summary table), and
Conclusion based on the P value.
Showing the calculation is a must. If calculation is missing,so please provide a step by step on the answers
Numerical answers in the yellow cells
Finite Mathematics for Business, Economics, Life Sciences and Social Sciences
Knowledge Booster
Learn more about
Need a deep-dive on the concept behind this application? Look no further. Learn more about this topic, statistics and related others by exploring similar questions and additional content below.


 College Algebra (MindTap Course List)AlgebraISBN:9781305652231Author:R. David Gustafson, Jeff HughesPublisher:Cengage Learning
 Glencoe Algebra 1, Student Edition, 9780079039897...AlgebraISBN:9780079039897Author:CarterPublisher:McGraw Hill
 Holt Mcdougal Larson Pre-algebra: Student Edition...AlgebraISBN:9780547587776Author:HOLT MCDOUGALPublisher:HOLT MCDOUGAL
 Big Ideas Math A Bridge To Success Algebra 1: Stu...AlgebraISBN:9781680331141Author:HOUGHTON MIFFLIN HARCOURTPublisher:Houghton Mifflin Harcourt