
Introductory Statistics (2nd Edition)
2nd Edition
ISBN: 9780321978271
Author: Robert Gould, Colleen N. Ryan
Publisher: PEARSON
expand_more
expand_more
format_list_bulleted
Videos
Textbook Question
Chapter 9, Problem 45SE
GPAs Thirty GPAs from a randomly selected sample of statistics students at Oxnard College are available at this text's website. Assume that the population distribution is approximately Normal. The technician in charge of records claimed that the population
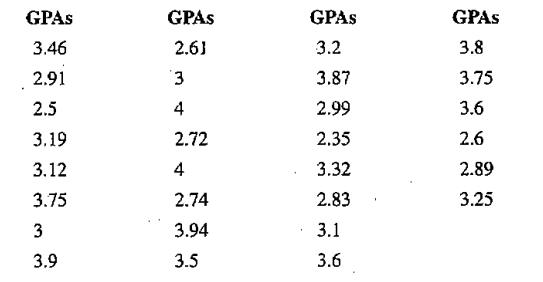
a. What is the sample mean? Is it higher or lower than the population mean of 2.81?
b. The chair of the mathematics department claims that statistics students typically have higher GPAs than the typical college student. Use the four-step procedure and the data provided to test this claim. Use a significance level of 0.05.
Expert Solution & Answer
Want to see the full answer?
Check out a sample textbook solution
Students have asked these similar questions
Business
https://www.hawkeslearning.com/Statistics/dbs2/datasets.html
NC Current Students - North Ce X | NC Canvas Login Links - North ( X
Final Exam Comprehensive x Cengage Learning
x
WASTAT - Final Exam - STAT
→
C
webassign.net/web/Student/Assignment-Responses/submit?dep=36055360&tags=autosave#question3659890_9
Part (b)
Draw a scatter plot of the ordered pairs.
N
Life
Expectancy
Life
Expectancy
80
70
600
50
40
30
20
10
Year of
1950
1970 1990
2010 Birth
O
Life
Expectancy
Part (c)
800
70
60
50
40
30
20
10
1950
1970 1990
W
ALT
林
$
#
4
R
J7
Year of
2010 Birth
F6
4+
80
70
60
50
40
30
20
10
Year of
1950 1970 1990
2010 Birth
Life
Expectancy
Ox
800
70
60
50
40
30
20
10
Year of
1950 1970 1990 2010 Birth
hp
P.B.
KA
&
7
80
% 5
H
A
B
F10
711
N
M
K
744
PRT SC
ALT
CTRL
Chapter 9 Solutions
Introductory Statistics (2nd Edition)
Ch. 9 - Ages A study of all the students at a small...Ch. 9 - Units A survey of 100 random full-time students at...Ch. 9 - Exam Scores The distribution of the scores on a...Ch. 9 - Exam Scores The distribution of the scores on a...Ch. 9 - Prob. 5SECh. 9 - Cellphone Calls Answers.com claims that the mean...Ch. 9 - Retirement Income Several times during the year,...Ch. 9 - Time Employed A human resources manager for a...Ch. 9 - Prob. 9SECh. 9 - Prob. 10SE
Ch. 9 - Babies Weights (Example 2) Some sources report...Ch. 9 - Babies’ Weights, Again Some sources report that...Ch. 9 - Prob. 13SECh. 9 - Prob. 14SECh. 9 - CLT Shapes (Example 4) One of the histograms is a...Ch. 9 - Prob. 16SECh. 9 - Prob. 17SECh. 9 - Student Ages The mean age of all 2550 students at...Ch. 9 - Prob. 19SECh. 9 - Prob. 20SECh. 9 - Prob. 21SECh. 9 - Prob. 22SECh. 9 - Prob. 23SECh. 9 - Random Numbers If you take samples of 40 lines...Ch. 9 - t* (Example 8) A researcher collects one sample of...Ch. 9 - t* A researcher collects a sample of 25...Ch. 9 - Hamburgers (Example 9) A hamburger chain sells...Ch. 9 - Drinks A fast-food chain sells drinks that it...Ch. 9 - Men’s Pulse Rates (Example 10) A random sample of...Ch. 9 - Prob. 30SECh. 9 - Prob. 31SECh. 9 - Prob. 32SECh. 9 - Confidence Interval Changes State whether each of...Ch. 9 - Confidence Interval Changes State whether each of...Ch. 9 - Potatoes The weights of four randomly and...Ch. 9 - Tomatoes The weights of four randomly and...Ch. 9 - Human Body Temperatures (Example 12) A random...Ch. 9 - Reaction Distance Data on the disk and website...Ch. 9 - Potatoes Use the data from exercise 9.35. a. If...Ch. 9 - Tomatoes Use the data from exercise 9.36. a. Using...Ch. 9 - Cholesterol In the U.S. Department of Health has...Ch. 9 - BMI A body mass index (BMI) of more than 25 is...Ch. 9 - Male Height In the United States, the population...Ch. 9 - Vegetarians' Weights The mean weight of all...Ch. 9 - GPAs Thirty GPAs from a randomly selected sample...Ch. 9 - Prob. 46SECh. 9 - GPAs Using the data from Exercise 9.45 on GPAs,...Ch. 9 - Prob. 48SECh. 9 - Atkins Diet Difference Ten people went on an...Ch. 9 - Pulse Difference The following numbers are the...Ch. 9 - Student Ages Suppose that 200 statistics students...Ch. 9 - Presidents’ Ages at Inauguration A 95 confidence...Ch. 9 - Prob. 53SECh. 9 - Prob. 54SECh. 9 - Televisions: CI (Example 14) Minitab output is...Ch. 9 - Pulse and Gender: CI Using data from NHANES, we...Ch. 9 - Televisions (Example 15) The table shows the...Ch. 9 - Pulse Rates Using data from NHANES, we looked at...Ch. 9 - Triglycerides Triglycerides are a form of fat...Ch. 9 - Systolic Blood Pressures When you have your blood...Ch. 9 - Triglycerides, Again Report and interpret the 95...Ch. 9 - Blood Pressures, Again Report and interpret the 95...Ch. 9 - Clothes Spending A random sample of 14 college...Ch. 9 - College Athletes’ Weights A random sample of male...Ch. 9 - Prob. 65SECh. 9 - College Athletes’ Weights In exercise 9.64, you...Ch. 9 - Textbook Prices, UCSB vs. CSUN (Example 16) The...Ch. 9 - Textbook Prices. OC vs. CSUN The prices of a...Ch. 9 - Females’ Pulse Rates before and after a Fright...Ch. 9 - Males’ Pulse Rates before and after a Fright...Ch. 9 - Organic Food A student compared organic food...Ch. 9 - Smoking Mothers The birth weights of 35 babies...Ch. 9 - Ages of Brides and Grooms Data for the ages of...Ch. 9 - Surfers Surfers and statistics students Rex...Ch. 9 - Self-Reported Heights of Men (Example 18) A random...Ch. 9 - Eating Out Jacqueline Loya, a statistics student,...Ch. 9 - 9.77, 9.79, and 9.80 For these questions, the data...Ch. 9 - Prob. 78SECh. 9 - 9.77, 9.79, and 9.80 For these questions, the data...Ch. 9 - 9.77, 9.79, and 9.80 For these questions, the data...Ch. 9 - Choose a test for each situation: one-sample...Ch. 9 - Choose a t-test for each situation: one-sample...Ch. 9 - Cones: 3 Tests A McDonald’s fact sheet says its...Ch. 9 - Prob. 84CRECh. 9 - Brain Size Brain size for 20 random women and 20...Ch. 9 - Prob. 86CRECh. 9 - Heart Rate before and after Coffee Elena Lucin, a...Ch. 9 - Exam Grades The final exam grades for a sample of...Ch. 9 - Hours of Television Viewing The number of hours...Ch. 9 - Reaction Distances Reaction distances in...Ch. 9 - Shift Sleep Hours A survey was done comparing the...Ch. 9 - Prob. 92CRECh. 9 - Maximum Tax Rate A random sample of 10 Democrats...Ch. 9 - Prob. 94CRECh. 9 - Groceries The table shows the prices of identical...Ch. 9 - Parents The following table shows the heights (in...Ch. 9 - Why Is n1 in the Sample Standard Deviation? Why do...Ch. 9 - Prob. 98CRECh. 9 - Construct two sets of body temperatures (in...Ch. 9 - Construct heights for 3 or more sets of twins (6...
Knowledge Booster


Learn more about
Need a deep-dive on the concept behind this application? Look no further. Learn more about this topic, statistics and related others by exploring similar questions and additional content below.Similar questions
- Harvard University California Institute of Technology Massachusetts Institute of Technology Stanford University Princeton University University of Cambridge University of Oxford University of California, Berkeley Imperial College London Yale University University of California, Los Angeles University of Chicago Johns Hopkins University Cornell University ETH Zurich University of Michigan University of Toronto Columbia University University of Pennsylvania Carnegie Mellon University University of Hong Kong University College London University of Washington Duke University Northwestern University University of Tokyo Georgia Institute of Technology Pohang University of Science and Technology University of California, Santa Barbara University of British Columbia University of North Carolina at Chapel Hill University of California, San Diego University of Illinois at Urbana-Champaign National University of Singapore McGill…arrow_forwardName Harvard University California Institute of Technology Massachusetts Institute of Technology Stanford University Princeton University University of Cambridge University of Oxford University of California, Berkeley Imperial College London Yale University University of California, Los Angeles University of Chicago Johns Hopkins University Cornell University ETH Zurich University of Michigan University of Toronto Columbia University University of Pennsylvania Carnegie Mellon University University of Hong Kong University College London University of Washington Duke University Northwestern University University of Tokyo Georgia Institute of Technology Pohang University of Science and Technology University of California, Santa Barbara University of British Columbia University of North Carolina at Chapel Hill University of California, San Diego University of Illinois at Urbana-Champaign National University of Singapore…arrow_forwardA company found that the daily sales revenue of its flagship product follows a normal distribution with a mean of $4500 and a standard deviation of $450. The company defines a "high-sales day" that is, any day with sales exceeding $4800. please provide a step by step on how to get the answers in excel Q: What percentage of days can the company expect to have "high-sales days" or sales greater than $4800? Q: What is the sales revenue threshold for the bottom 10% of days? (please note that 10% refers to the probability/area under bell curve towards the lower tail of bell curve) Provide answers in the yellow cellsarrow_forward
- Find the critical value for a left-tailed test using the F distribution with a 0.025, degrees of freedom in the numerator=12, and degrees of freedom in the denominator = 50. A portion of the table of critical values of the F-distribution is provided. Click the icon to view the partial table of critical values of the F-distribution. What is the critical value? (Round to two decimal places as needed.)arrow_forwardA retail store manager claims that the average daily sales of the store are $1,500. You aim to test whether the actual average daily sales differ significantly from this claimed value. You can provide your answer by inserting a text box and the answer must include: Null hypothesis, Alternative hypothesis, Show answer (output table/summary table), and Conclusion based on the P value. Showing the calculation is a must. If calculation is missing,so please provide a step by step on the answers Numerical answers in the yellow cellsarrow_forwardShow all workarrow_forward
arrow_back_ios
SEE MORE QUESTIONS
arrow_forward_ios
Recommended textbooks for you
 Big Ideas Math A Bridge To Success Algebra 1: Stu...AlgebraISBN:9781680331141Author:HOUGHTON MIFFLIN HARCOURTPublisher:Houghton Mifflin Harcourt
 Glencoe Algebra 1, Student Edition, 9780079039897...AlgebraISBN:9780079039897Author:CarterPublisher:McGraw Hill
 Holt Mcdougal Larson Pre-algebra: Student Edition...AlgebraISBN:9780547587776Author:HOLT MCDOUGALPublisher:HOLT MCDOUGAL
Big Ideas Math A Bridge To Success Algebra 1: Stu...
Algebra
ISBN:9781680331141
Author:HOUGHTON MIFFLIN HARCOURT
Publisher:Houghton Mifflin Harcourt
Glencoe Algebra 1, Student Edition, 9780079039897...
Algebra
ISBN:9780079039897
Author:Carter
Publisher:McGraw Hill
Holt Mcdougal Larson Pre-algebra: Student Edition...
Algebra
ISBN:9780547587776
Author:HOLT MCDOUGAL
Publisher:HOLT MCDOUGAL
Hypothesis Testing using Confidence Interval Approach; Author: BUM2413 Applied Statistics UMP;https://www.youtube.com/watch?v=Hq1l3e9pLyY;License: Standard YouTube License, CC-BY
Hypothesis Testing - Difference of Two Means - Student's -Distribution & Normal Distribution; Author: The Organic Chemistry Tutor;https://www.youtube.com/watch?v=UcZwyzwWU7o;License: Standard Youtube License