a)
To determine: The theoretical minimum number of workstations.
a)
Answer to Problem 23P
The theoretical minimum number of workstations is 5 workstations.
Explanation of Solution
Given information:
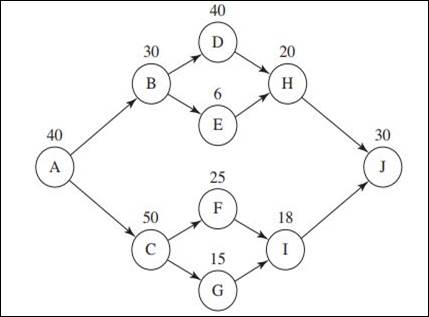
| Task | Time (seconds) | Immediate predecessors |
| A | 40 | - |
| B | 30 | A |
| C | 50 | A |
| D | 40 | B |
| E | 6 | B |
| F | 25 | C |
| G | 15 | C |
| H | 20 | D, E |
| I | 18 | F, G |
| J | 30 | H, I |
| Total | 274 |
- Output is 60 iStars / hour
Calculation of cycle time:
The requirement is to produce 60 iStars / hour. Hence, the cycle time for one iStar will be:
Formula to calculate theoretical minimum number of workstations:
Calculation of theoretical minimum number of workstations:
The theoretical minimum number of workstations is 5 workstations.
b)
To balance: The assembly line.
b)
Explanation of Solution
Precedence diagram:
List of most following tasks:
| Tasks | Following tasks |
| A | 9 |
| B | 4 |
| C | 4 |
| D | 2 |
| E | 2 |
| F | 2 |
| G | 2 |
| H | 1 |
| I | 1 |
| J | 0 |
Assignment of different tasks to different workstations:
| Workstation | Elligible tasks | Selected tasks | Task time (seconds) | Available cycle time (seconds) | Remarks |
| 1 | 60 | ||||
| A | A | 40 | 20 | ||
| B,C | 20 (Idle time) | Cycle time is less than task time | |||
| 2 | 60 | ||||
| B, C | C | 7 | 50 | Tie broken randomnly | |
| B, F, G | 10 (Idle time) | Cycle time is less than task time | |||
| 3 | 60 | ||||
| B, F, G | B | 30 | 30 | Task B has most following tasks. | |
| D, E, F, G | F | 25 | 24 | Tie broken randomnly | |
| D, E, G | 1 (Idle time) | Cycle time is less than task time | |||
| 4 | 60 | ||||
| D, E, G | D | 40 | 20 | Tie broken randomnly | |
| E, G | G | 15 | 5 | Tie broken randomnly | |
| E,I | 5 (Idle time) | Cycle time is less than task time | |||
| 5 | 60 | ||||
| E, I | E | 6 | 54 | Task E has most following tasks. | |
| I, H | H | 20 | 34 | Tie broken randomnly | |
| I | I | 18 | 2 | Task I is only elligible task | |
| 2 (Idle time) | |||||
| 6 | 60 | ||||
| J | J | 30 | 30 | Task J is the remaining task | |
| 30 (Idle time) |
| Workstation | Task assigned | Idle time |
| 1 | A | 20 |
| 2 | C | 10 |
| 3 | B, F | 1 |
| 4 | D, G | 5 |
| 5 | E, H, I | 2 |
| 6 | J | 30 |
| Total | 68 |
c)
To determine: The actual number of workstations.
c)
Answer to Problem 23P
The actual number of workstations is 6.
Explanation of Solution
| Workstation | Task assigned | Idle time |
| 1 | A | 20 |
| 2 | C | 10 |
| 3 | B, F | 1 |
| 4 | D, G | 5 |
| 5 | E, H, I | 2 |
| 6 | J | 30 |
| Total | 68 |
The actual number of workstations is 6.
d)
To determine: The efficiency.
Introduction:
Efficiency:
Efficiency is the measure of what is actually produced as opposed to what can be theoretically produced with the same amount of resources.
d)
Answer to Problem 23P
The efficiency is 76.11%.
Explanation of Solution
Formula to calculate efficiency:
Calculation of efficiency:
The efficiency is 76.11%.
Want to see more full solutions like this?
Chapter 9 Solutions
Pearson eText Principles of Operations Management: Sustainability and Supply Chain Management -- Instant Access (Pearson+)

- Define risk management and explain its importance in a small business.arrow_forward1. Define risk management and explain its importance in a small business. 2. Describe three types of risks commonly faced by entrepreneurs. 3. Explain the purpose of a risk register. 4. List and briefly describe four risk response strategies. (5 marks) (6 marks) (4 marks) (8 marks) 5. Explain how social media can pose a risk to small businesses. (5 marks) 6. Identify and describe any four hazard-based risks. (8 marks) 7. Mention four early warning indicators that a business may be at risk. (4 marks)arrow_forwardState whether each of the following statements is TRUE or FALSE. 1. Risk management involves identifying, analysing, and mitigating risks. 2. Hazard risks include interest rate fluctuations. 3. Entrepreneurs should avoid all forms of risks. 4. SWOT analysis is a tool for risk identification. 5. Scenario building helps visualise risk responses. 6. Risk appetite defines how much risk an organisation is willing to accept. 7. Diversification is a risk reduction strategy. 8. A risk management framework must align with business goals. 9. Political risk is only relevant in unstable countries. 10. All risks can be eliminated through insurance.arrow_forward
- 9. A hazard-based risk includes A. Political instability B. Ergonomic issues C. Market demand D. Taxation changesarrow_forward8. Early warning indicators help businesses to A. Avoid legal actions B. Grow rapidly C. Detect potential risks D. Hire employees 9. A hazard-based risk includes A. Political instability B. Ergonomic issues C. Market demand D. Taxation changesarrow_forward10. Which risk category refers to taking advantage of a new opportunity despite potential challenges? A. Hazard B. Uncertainty C. Opportunity D. Strategicarrow_forward
 Practical Management ScienceOperations ManagementISBN:9781337406659Author:WINSTON, Wayne L.Publisher:Cengage,
- MarketingMarketingISBN:9780357033791Author:Pride, William MPublisher:South Western Educational Publishing