Three-Strikes Law California’s controversial “three-strikes law” requires judges to sentence anyone convicted of three felony offenses to life in prison. Supporters say that this decreases crime both because it is a strong deterrent and because career criminals are removed from the streets. Opponents argue (among other things) that people serving life sentences have nothing to lose, so violence within the prison system increases. To test the opponents’ claim, researchers examined data starting from the mid-1990s from the California Department of Corrections. “Three Strikes: Yes” means the person had committed three or more felony offenses and was probably serving a life sentence. “Three Strikes: No” means the person had committed no more than two offenses. “Misconduct” includes serious offenses (such as assaulting an officer) and minor offenses (such as not standing for a count). “No Misconduct” means the offender had not committed any offenses in prison. a. Compare the proportions of misconduct in these samples. Which proportion is higher, the proportion of misconduct for those who had three strikes or that for those who did not have three strikes? Explain. b. Treat this as though it were a random sample, and determine whether those with three strikes tend to have more offenses than those who do not. Use a 0.05 significance level.
Three-Strikes Law California’s controversial “three-strikes law” requires judges to sentence anyone convicted of three felony offenses to life in prison. Supporters say that this decreases crime both because it is a strong deterrent and because career criminals are removed from the streets. Opponents argue (among other things) that people serving life sentences have nothing to lose, so violence within the prison system increases. To test the opponents’ claim, researchers examined data starting from the mid-1990s from the California Department of Corrections. “Three Strikes: Yes” means the person had committed three or more felony offenses and was probably serving a life sentence. “Three Strikes: No” means the person had committed no more than two offenses. “Misconduct” includes serious offenses (such as assaulting an officer) and minor offenses (such as not standing for a count). “No Misconduct” means the offender had not committed any offenses in prison. a. Compare the proportions of misconduct in these samples. Which proportion is higher, the proportion of misconduct for those who had three strikes or that for those who did not have three strikes? Explain. b. Treat this as though it were a random sample, and determine whether those with three strikes tend to have more offenses than those who do not. Use a 0.05 significance level.
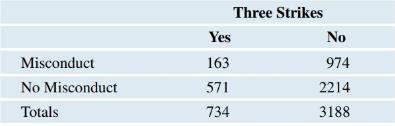
Solution Summary: The author compares the proportions of misconduct in a group of prisoners sentenced under the three-strike law and those without it.
Three-Strikes Law California’s controversial “three-strikes law” requires judges to sentence anyone convicted of three felony offenses to life in prison. Supporters say that this decreases crime both because it is a strong deterrent and because career criminals are removed from the streets. Opponents argue (among other things) that people serving life sentences have nothing to lose, so violence within the prison system increases. To test the opponents’ claim, researchers examined data starting from the mid-1990s from the California Department of Corrections. “Three Strikes: Yes” means the person had committed three or more felony offenses and was probably serving a life sentence. “Three Strikes: No” means the person had committed no more than two offenses. “Misconduct” includes serious offenses (such as assaulting an officer) and minor offenses (such as not standing for a count). “No Misconduct” means the offender had not committed any offenses in prison.
a. Compare the proportions of misconduct in these samples. Which proportion is higher, the proportion of misconduct for those who had three strikes or that for those who did not have three strikes? Explain.
b. Treat this as though it were a random sample, and determine whether those with three strikes tend to have more offenses than those who do not. Use a
0.05
significance level.
08:34
◄ Classroom
07:59
Probs. 5-32/33
D
ا.
89
5-34. Determine the horizontal and vertical components
of reaction at the pin A and the normal force at the smooth
peg B on the member.
A
0,4 m
0.4 m
Prob. 5-34
F=600 N
fr
th
ar
0.
163586
5-37. The wooden plank resting between the buildings
deflects slightly when it supports the 50-kg boy. This
deflection causes a triangular distribution of load at its ends.
having maximum intensities of w, and wg. Determine w
and wg. each measured in N/m. when the boy is standing
3 m from one end as shown. Neglect the mass of the plank.
0.45 m
3 m
Examine the Variables: Carefully review and note the names of all variables in the dataset. Examples of these variables include:
Mileage (mpg)
Number of Cylinders (cyl)
Displacement (disp)
Horsepower (hp)
Research: Google to understand these variables.
Statistical Analysis: Select mpg variable, and perform the following statistical tests. Once you are done with these tests using mpg variable, repeat the same with hp
Mean
Median
First Quartile (Q1)
Second Quartile (Q2)
Third Quartile (Q3)
Fourth Quartile (Q4)
10th Percentile
70th Percentile
Skewness
Kurtosis
Document Your Results:
In RStudio: Before running each statistical test, provide a heading in the format shown at the bottom. “# Mean of mileage – Your name’s command”
In Microsoft Word: Once you've completed all tests, take a screenshot of your results in RStudio and paste it into a Microsoft Word document. Make sure that snapshots are very clear. You will need multiple snapshots. Also transfer these results to the…
Chapter 8 Solutions
The King's minion: Richelieu, Louis XIII, and the affair of Cinq-Mars
Elementary Statistics ( 3rd International Edition ) Isbn:9781260092561
Knowledge Booster
Learn more about
Need a deep-dive on the concept behind this application? Look no further. Learn more about this topic, statistics and related others by exploring similar questions and additional content below.


 Glencoe Algebra 1, Student Edition, 9780079039897...AlgebraISBN:9780079039897Author:CarterPublisher:McGraw Hill