Reading (Example 14) The researchers in a Pew study interviewed two random samples, one in 2015 and one in 2018. Both samples were asked, “Have you read a print book in the last year?” The results are shown in the table below. a. Find and compare the sample proportions that had read a print book for these two groups. b. Find a pooled estimate of the sample proportion. c. Has the proportion who read print books increased? Find the observed value of the test statistic to test the hypotheses H 0 : p 2015 = p 2018 and H a : p 2015 < p 2018 assuming the conditions for a two-proportion z -test hold.
Reading (Example 14) The researchers in a Pew study interviewed two random samples, one in 2015 and one in 2018. Both samples were asked, “Have you read a print book in the last year?” The results are shown in the table below. a. Find and compare the sample proportions that had read a print book for these two groups. b. Find a pooled estimate of the sample proportion. c. Has the proportion who read print books increased? Find the observed value of the test statistic to test the hypotheses H 0 : p 2015 = p 2018 and H a : p 2015 < p 2018 assuming the conditions for a two-proportion z -test hold.
Solution Summary: The author compares the sample proportions of people who read a print book and the total number of participants in the survey.
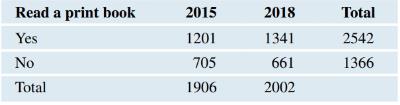
Reading (Example 14) The researchers in a Pew study interviewed two random samples, one in 2015 and one in 2018. Both samples were asked, “Have you read a print book in the last year?” The results are shown in the table below.
a. Find and compare the sample proportions that had read a print book for these two groups.
b. Find a pooled estimate of the sample proportion.
c. Has the proportion who read print books increased? Find the observed value of the test statistic to test the hypotheses
H
0
:
p
2015
=
p
2018
and
H
a
:
p
2015
<
p
2018
assuming the conditions for a two-proportion
z
-test
hold.
Question 2
The data below provides the battery life of thirty eight (38) motorcycle batteries.
100 83 83 105 110 81 114
99 101 105 78 115 74 96
106
89
94 81 106 91 93 86
79 103 94 108 113 100
117 120
77 93
93 85 76
89 78 88
680
a. Test the hypothesis that mean battery life is greater than 90. Use the 1% level of
significance.
b. Determine if the mean battery life is different from 80. Use the 10% level of
significance. Show all steps for the hypothesis test
c. Would your conlcusion in part (b) change at the 5% level of significance? |
d. Confirm test results in part (b) using JASP. Note: All JASP input files and output
tables should be provided
Suppose that 80% of athletes at a certain college graduate. You randomly select eight athletes. What’s the chance that at most 7 of them graduate?
Suppose that you flip a fair coin four times. What’s the chance of getting at least one head?
Chapter 8 Solutions
The King's minion: Richelieu, Louis XIII, and the affair of Cinq-Mars
Need a deep-dive on the concept behind this application? Look no further. Learn more about this topic, statistics and related others by exploring similar questions and additional content below.


 Holt Mcdougal Larson Pre-algebra: Student Edition...AlgebraISBN:9780547587776Author:HOLT MCDOUGALPublisher:HOLT MCDOUGAL
 Glencoe Algebra 1, Student Edition, 9780079039897...AlgebraISBN:9780079039897Author:CarterPublisher:McGraw Hill
 Big Ideas Math A Bridge To Success Algebra 1: Stu...AlgebraISBN:9781680331141Author:HOUGHTON MIFFLIN HARCOURTPublisher:Houghton Mifflin Harcourt
 College Algebra (MindTap Course List)AlgebraISBN:9781305652231Author:R. David Gustafson, Jeff HughesPublisher:Cengage Learning