
Concept explainers
Draw the influence lines for the reaction moment at support A, the vertical reactions at supports A and F and the shear and bending moment at point E.
Explanation of Solution
Calculation:
Influence line for moment at support A.
Apply a 1 kN unit moving load at a distance of x from left end C.
Sketch the free body diagram of frame as shown in Figure 1.
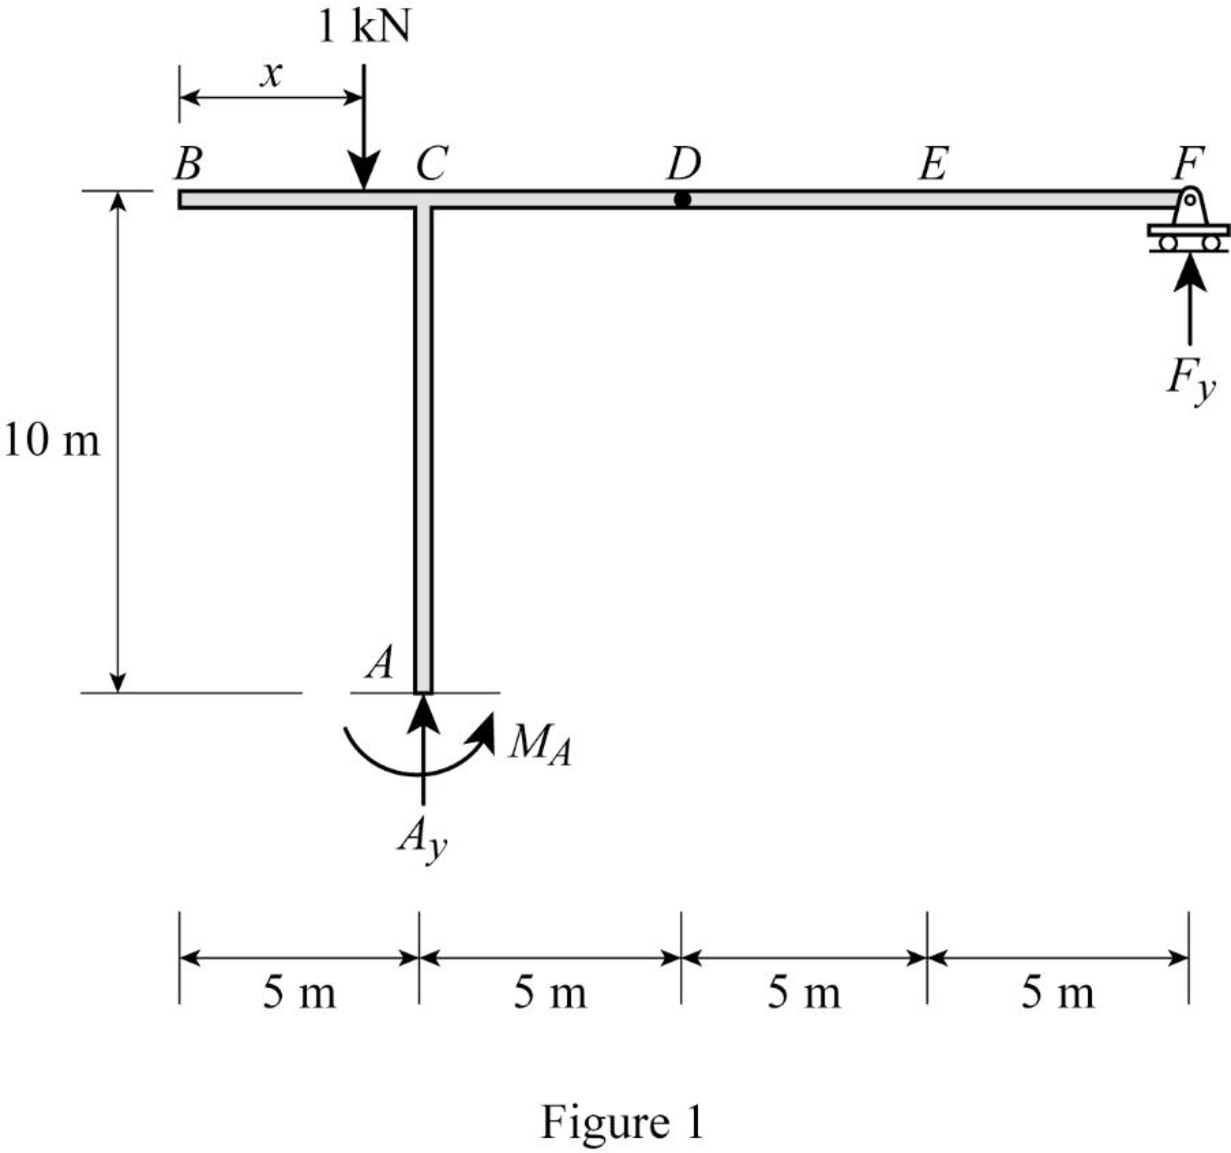
Refer Figure 1.
Apply 1 kN load just left of C
Take moment at A from B.
Consider clockwise moment as positive and anticlockwise moment as negative.
Apply 1 kN load just right of C and just left of D
Take moment at A from D.
Apply 1 kN load just right of D and just right of F
Take moment at A from F.
Thus, the equation of moment at A as follows,
Find the influence line ordinate of
Substitute 0 for
Find the influence line ordinate of
The vertical reaction at F is 1 kN when 1 kN applied at F.
Substitute 20 m for
Thus, the influence line ordinate of
Similarly calculate the influence line ordinate of
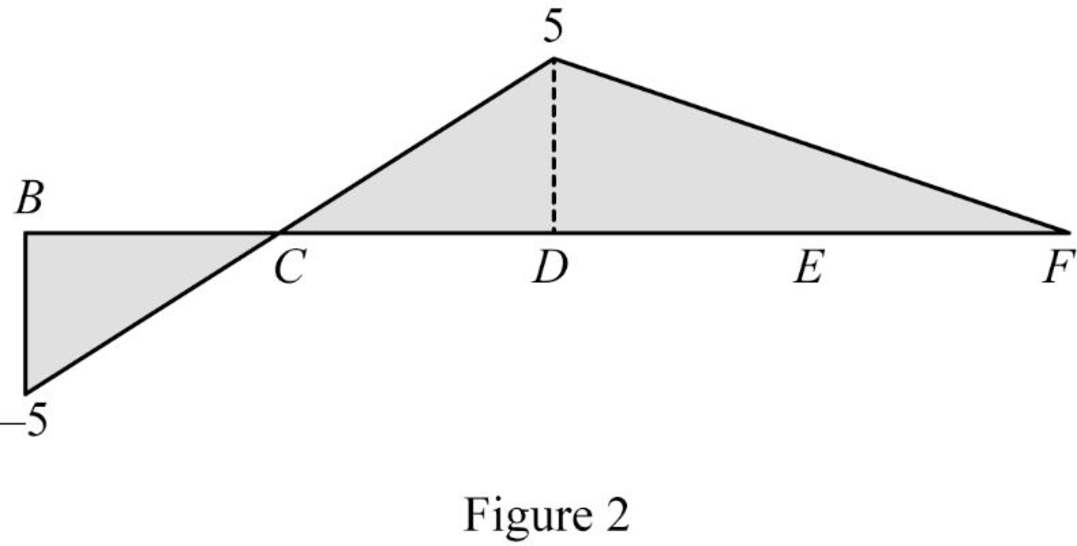
| x (m) | Points | Influence line ordinate of |
| 0 | B | ‑5 |
| 5 | C | 0 |
| 10 | D | 5 |
| 20 | F | 0 |
Sketch the influence line diagram for the moment at support A using Table 1 as shown in Figure 2.
Influence line for vertical reaction at support F.
Apply a 1 kN unit moving load at a distance of x from left end C.
Refer Figure 1.
Find the vertical support reaction
Apply 1 kN load just left of D
Consider section DF.
Consider moment equilibrium at point D.
Consider clockwise moment as positive and anticlockwise moment as negative
Apply 1 kN load just right of D
Consider section DF.
Consider moment equilibrium at point D.
Consider clockwise moment as positive and anticlockwise moment as negative
Thus, the equation of vertical support reaction at F as follows,
Find the influence line ordinate of
Substitute 20 for
Thus, the influence line ordinate of
Similarly calculate the influence line ordinate of
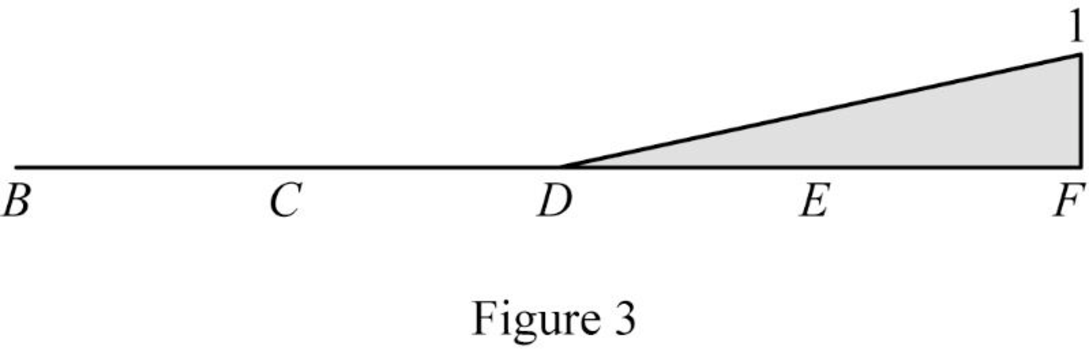
| x (m) | Points | Influence line ordinate of |
| 0 | B | 0 |
| 5 | C | 0 |
| 10 | D | 0 |
| 15 | E | 0.5 |
| 20 | F | 1 |
Sketch the influence line diagram for the vertical reaction at support F using Table 2 as shown in Figure 3.
Influence line for vertical reaction at support A.
Apply a 1 kN unit moving load at a distance of x from left end C.
Refer Figure 1.
Apply vertical equilibrium in the system.
Consider upward force as positive and downward force as negative.
Find the equation of vertical support reaction
Substitute 0 for
Find the equation of vertical support reaction
Substitute
Thus, the equation of vertical support reaction at A as follows,
Find the influence line ordinate of
Substitute 20 m for
Thus, the influence line ordinate of
Similarly calculate the influence line ordinate of
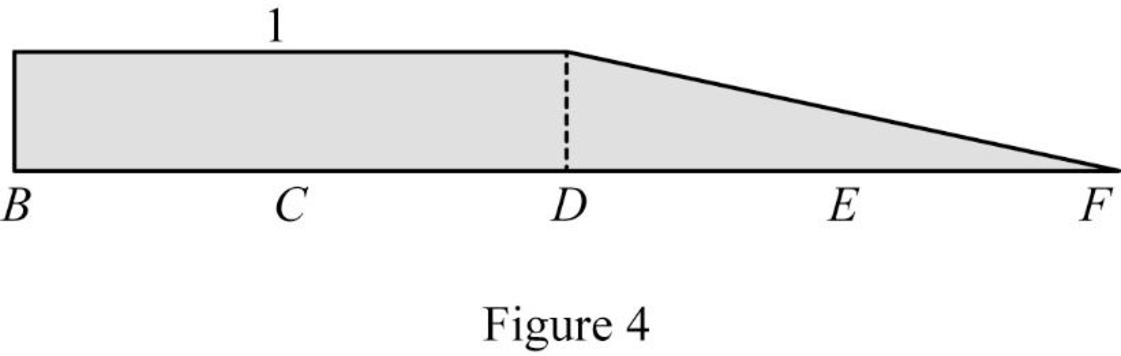
| x (m) | Points | Influence line ordinate of |
| 0 | B | 1 |
| 5 | C | 1 |
| 10 | D | 1 |
| 15 | E | 0.5 |
| 20 | F | 0 |
Sketch the influence line diagram for the vertical reaction at support A using Table 3 as shown in Figure 4.
Influence line for shear at point E.
Sketch the free body diagram of the section BD as shown in Figure 5.
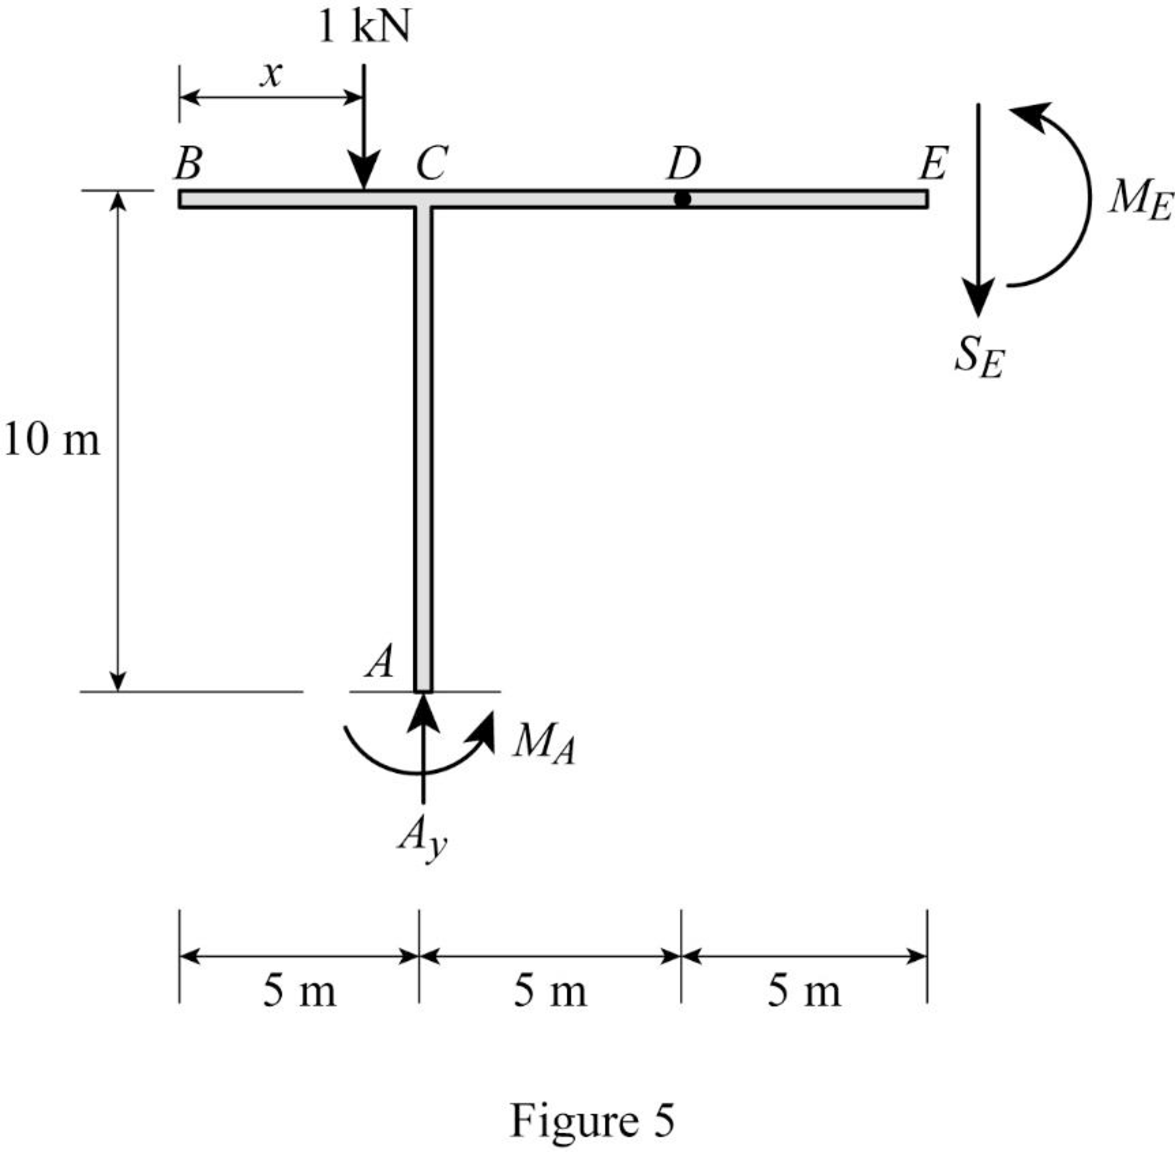
Refer Figure 5.
Apply equilibrium equation of forces.
Consider upward force as positive
Find the equation of shear force at E of portion BD
Substitute
Find the equation of shear force at E of portion DE
Substitute
Find the equation of shear force at E of portion EF
Sketch the free body diagram of the section EF as shown in Figure 6.
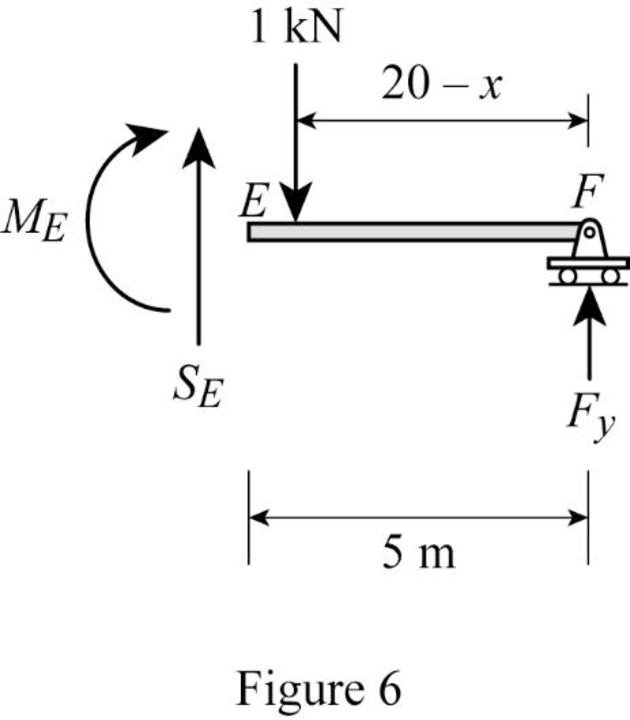
Refer Figure 6.
Apply equilibrium equation of forces.
Consider upward force as positive
Substitute
Thus, the equations of the influence line for
Find the influence line ordinate of
Substitute 15 m for
Thus, the influence line ordinate of
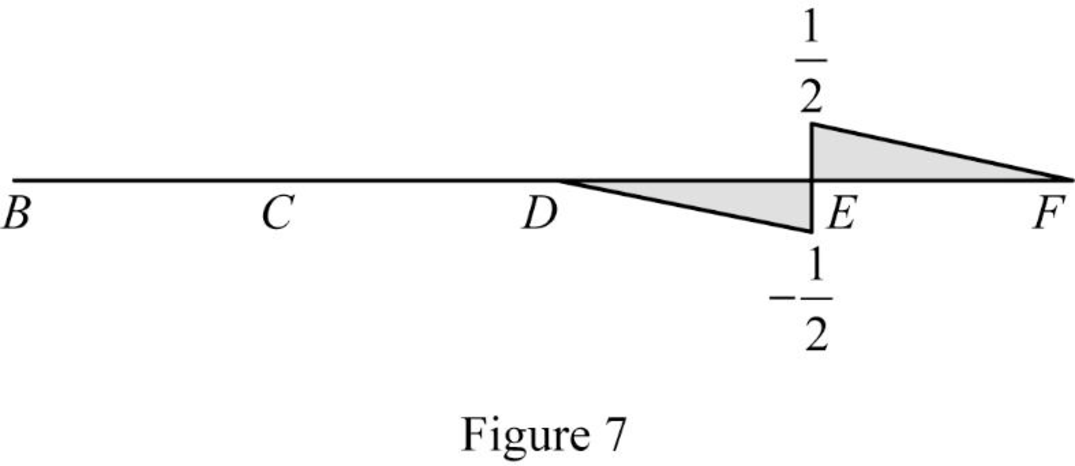
Find the shear force of
| x (m) | Points | Influence line ordinate of |
| 0 | B | 0 |
| 5 | 0 | |
| 10 | 0 | |
| 15 | ||
| 15 | ||
| 20 | F | 0 |
Draw the influence lines for the shear force at point E using Table 4 as shown in Figure 7.
Influence line for moment at point E.
Refer Figure 5.
Consider section BE.
Consider clockwise moment as positive and anticlockwise moment as negative.
Take moment at E.
Find the equation of moment at E of portion BE.
Find the equation of moment at E of portion BD
Substitute
Find the equation of moment at E of portion DE
Substitute
Substitute
Refer Figure 6.
Consider section EF.
Find the equation of moment at E of portion EF
Consider clockwise moment as positive and anticlockwise moment as negative.
Take moment at E.
Find the equation of moment at E of portion EF.
Substitute
Thus, the equations of the influence line for
Find the influence line ordinate of
Substitute 15 m for
Thus, the influence line ordinate of
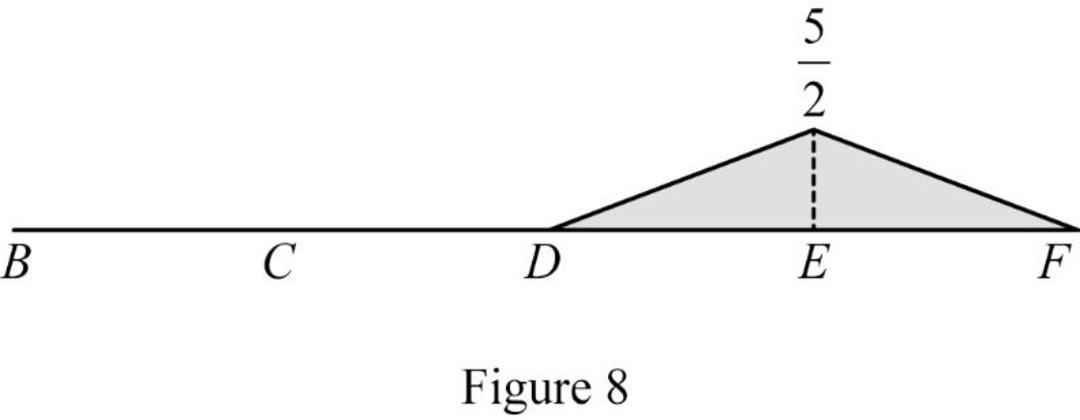
Find the moment at various points of x using the Equations (5) and (6) and summarize the value as in Table 5.
| x (m) | Points | Influence line ordinate of |
| 0 | B | 0 |
| 5 | C | 0 |
| 10 | D | 0 |
| 15 | E | |
| 20 | F | 0 |
Draw the influence lines for the moment at point E using Table 5 as shown in Figure 8.
Therefore, the influence lines for the vertical reactions at supports A and F and the influence lines for the shear and bending moment at point E are drawn.
Want to see more full solutions like this?
Chapter 8 Solutions
Structural Analysis


- Problem 5 (A, B, C and D are fixed). Find the reactions at A and D 8 k B 15 ft A -20 ft C 10 ft Darrow_forwardProblem 4 (A, B, E, D and F are all pin connected and C is fixed) Find the reactions at A, D and F 8 m B 6m E 12 kN D F 4 marrow_forwardProblem 1 (A, C and D are pins) Find the reactions and A, C and D. D 6 m B 12 kN/m 8 m A C 6 marrow_forward
- Uniform Grade of Pipe Station of Point A is 9+50.00. Elevation Point A = 250.75.Station of Point B is 13+75.00. Elevation Point B = 244.10 1) Calculate flowline of pipe elevations at every 50 ft. interval (Half Station). 2) Tabulate station and elevation for each station like shown on example 3) Draw Sketcharrow_forward40m 150N B 40marrow_forwardquantity surveyingarrow_forward
- Quantity Surveyingarrow_forwardquantity surveyingarrow_forwardNote: Please accurately answer it!. I'll give it a thumbs up or down based on the answer quality and precision. Question: What is the group name of Sample B in problem 3 from the image?. By also using the ASTM flow chart!. This unit is soil mechanics btwarrow_forward
- Pick the rural location of a project site in Victoria, and its catchment area-not bigger than 25 sqkm, and given the below information, determine the rainfall intensity for ARI = 5, 50, 100 year storm event. Show all the details of the procedure. Each student must propose different length of streams and elevations. Use fig below as a sample only. Pt. E-ht. 95.0 200m 600m PLD-M. 91.0 300m Pt. C-93.0 300m PL.B-ht. 92.0 PL.F-ht. 96.0 500m Pt. A-M. 91.00 To be deemed satisfactory the solution must include: Q.F1.1.Choice of catchment location Q.F1.2. A sketch displaying length of stream and elevation Q.F1.3. Catchment's IFD obtained from the Buro of Metheorology for specified ARI Q.F1.4.Calculation of the time of concentration-this must include a detailed determination of the equivalent slope. Q.F1.5.Use must be made of the Bransby-Williams method for the determination of the equivalent slope. Q.F1.6.The graphical display of the estimation of intensities for ARI 5,50, 100 must be shown.arrow_forwardQUANTITY SURVEYINGarrow_forward3. (a) Use method of joints to determine forces in all members (all distances are in mm) (b) Find the resultant force at the pin support and state its angle of inclination FIGURE 2 2400 3.3 kN 6 3.6 ky 12 2 + 2400 0.7 kN + 2400 3.3kN + 2400arrow_forward