
Videos
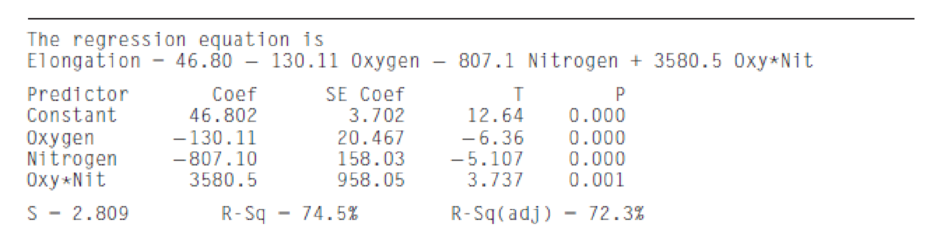
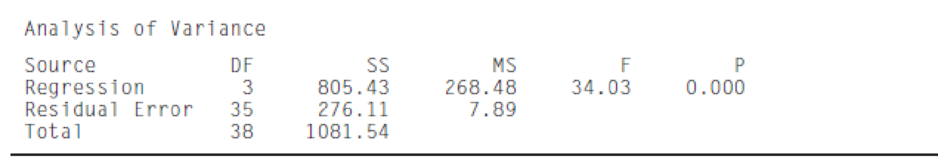
The article “Advances in Oxygen Equivalence liquations for Predicting the Properties of Titanium Welds” (D. Harwig, W. Ittiwattana, and H. Castner, The Welding Journal, 2001:126s–136s) reports an experiment to predict various properties of titanium welds. Among other properties, the elongation (in %) was measured, along with the oxygen content and nitrogen content (both in percent). The following MINITAB output presents results of fitting the model
- a. Predict the elongation for a weld with an oxygen content of 0.15% and a nitrogen content of 0.01%.
- b. If two welds both have a nitrogen content of 0.006%, and their oxygen content differs by 0.05%, what would you predict their difference in elongation to be?
- c. Two welds have identical oxygen contents, and nitrogen contents that differ by 0.005%. Is this enough information to predict their difference in elongation? If so, predict the elongation. If not, explain what additional information is needed.
a.
Find the predicted elongation percent of a weld with 0.15% of oxygen content and 0.01% of nitrogen content.
Answer to Problem 1SE
The predicted elongation percent of a weld with 0.15% of oxygen content and 0.01% of nitrogen content is likely to be 24.6%.
Explanation of Solution
Calculation:
The data represents the MINITAB output of the regression model
Multiple linear regression model:
A multiple linear regression model is given as
The ‘Coefficient’ column of the regression analysis MINITAB output gives the slopes corresponding to the respective variables stored in the column ‘Predictor’.
Let
From the accompanying MINITAB output, the intercept is
The estimates of the slopes are:
Thus, using the definition of a multiple regression model, the multiple regression equation is:
Here,
Predicted elongation percent of a weld:
Thus, the predicted elongation percent of a weld with 0.15% of oxygen content and 0.01% of nitrogen content is likely to be 24.6%.
b.
Find the change between the elongation percent of the two welds when the nitrogen content is 0.006% for both the welds with one weld containing 0.05% more oxygen content.
Answer to Problem 1SE
The elongation percent of two welds differ by –5.43% when the nitrogen content is 0.006% for both the welds with one weld containing 0.05% more oxygen content.
Explanation of Solution
Justification:
Slope in a multiple regression equation:
The slope
The multiple regression line is,
The coefficient or slope of Oxygen content in the regression model is
From this it can be said that, the value of elongation percent decreases by 130.11 for a 1% increase in Oxygen content, provided the effects of Nitrogen content is accounted for.
Here, both the welds have same Nitrogen content 0.006% and one weld has 0.05% more oxygen content than the other.
The change between the elongation percent of two welds is,
Thus, the elongation percent of two welds differ by –5.43% when the nitrogen content is 0.006% for both the welds with one weld containing 0.05% more oxygen content.
c.
Check whether it is possible to estimate the change in the elongation percent of the two welds when the nitrogen content is same for both the welds with one weld containing 0.005% more oxygen content.
If possible, predict the change.
Answer to Problem 1SE
No, it is not possible to estimate the change in the elongation percent of the two welds when the nitrogen content is same for both the welds with one weld containing 0.005% more oxygen content.
Explanation of Solution
Justification:
Slope in a multiple regression equation:
The slope
The multiple regression line is,
Here, the elongation is dependent on the nitrogen content, oxygen content and the interaction of nitrogen and oxygen content.
Hence, the coefficient of
Therefore, it is not possible to determine the change in the elongation percent only with the value of oxygen content.
Thus, it is not possible to estimate the change in the elongation percent of the two welds when the nitrogen content is same for both the welds with one weld containing 0.005% more oxygen content.
Want to see more full solutions like this?
Chapter 8 Solutions
EBK STATISTICS FOR ENGINEERS AND SCIENT
Additional Math Textbook Solutions
Elementary and Intermediate Algebra: Concepts and Applications (7th Edition)
APPLIED STAT.IN BUS.+ECONOMICS
Introductory Statistics
Calculus: Early Transcendentals (2nd Edition)
Elementary Statistics: Picturing the World (7th Edition)
Algebra and Trigonometry (6th Edition)


- A survey of 581 citizens found that 313 of them favor a new bill introduced by the city. We want to find a 95% confidence interval for the true proportion of the population who favor the bill. What is the lower limit of the interval? Enter the result as a decimal rounded to 3 decimal digits. Your Answer:arrow_forwardLet X be a continuous RV with PDF where a > 0 and 0 > 0 are parameters. verify that f-∞ /x (x)dx = 1. Find the CDF, Fx (7), of X.arrow_forward6. [20] Let X be a continuous RV with PDF 2(1), 1≤x≤2 fx(x) = 0, otherwisearrow_forward
- A survey of 581 citizens found that 313 of them favor a new bill introduced by the city. We want to find a 95% confidence interval for the true proportion of the population who favor the bill. What is the lower limit of the interval? Enter the result as a decimal rounded to 3 decimal digits. Your Answer:arrow_forwardA survey of 581 citizens found that 313 of them favor a new bill introduced by the city. We want to find a 95% confidence interval for the true proportion of the population who favor the bill. What is the lower limit of the interval? Enter the result as a decimal rounded to 3 decimal digits. Your Answer:arrow_forward2. The SMSA data consisting of 141 observations on 10 variables is fitted by the model below: 1 y = Bo+B1x4 + ẞ2x6 + ẞ3x8 + √1X4X8 + V2X6X8 + €. See Question 2, Tutorial 3 for the meaning of the variables in the above model. The following results are obtained: Estimate Std. Error t value Pr(>|t|) (Intercept) 1.302e+03 4.320e+02 3.015 0.00307 x4 x6 x8 x4:x8 x6:x8 -1.442e+02 2.056e+01 -7.013 1.02e-10 6.340e-01 6.099e+00 0.104 0.91737 -9.455e-02 5.802e-02 -1.630 0.10550 2.882e-02 2.589e-03 11.132 1.673e-03 7.215e-04 2.319 F) x4 1 3486722 3486722 17.9286 4.214e-05 x6 1 14595537 x8 x4:x8 x6:x8 1 132.4836 < 2.2e-16 1045693 194478 5.3769 0.02191 1 1198603043 1198603043 6163.1900 < 2.2e-16 1 25765100 25765100 1045693 Residuals 135 26254490 Estimated variance matrix (Intercept) x4 x6 x8 x4:x8 x6:x8 (Intercept) x4 x6 x8 x4:x8 x6:x8 0.18875694 1.866030e+05 -5.931735e+03 -2.322825e+03 -16.25142055 0.57188953 -5.931735e+03 4.228816e+02 3.160915e+01 0.61621781 -0.03608028 -0.00445013 -2.322825e+03…arrow_forward
- In some applications the distribution of a discrete RV, X resembles the Poisson distribution except that 0 is not a possible value of X. Consider such a RV with PMF where 1 > 0 is a parameter, and c is a constant. (a) Find the expression of c in terms of 1. (b) Find E(X). (Hint: You can use the fact that, if Y ~ Poisson(1), the E(Y) = 1.)arrow_forwardSuppose that X ~Bin(n,p). Show that E[(1 - p)] = (1-p²)".arrow_forwardI need help with this problem and an explanation of the solution for the image described below. (Statistics: Engineering Probabilities)arrow_forward
- I need help with this problem and an explanation of the solution for the image described below. (Statistics: Engineering Probabilities)arrow_forwardThis exercise is based on the following data on four bodybuilding supplements. (Figures shown correspond to a single serving.) Creatine(grams) L-Glutamine(grams) BCAAs(grams) Cost($) Xtend(SciVation) 0 2.5 7 1.00 Gainz(MP Hardcore) 2 3 6 1.10 Strongevity(Bill Phillips) 2.5 1 0 1.20 Muscle Physique(EAS) 2 2 0 1.00 Your personal trainer suggests that you supplement with at least 10 grams of creatine, 39 grams of L-glutamine, and 90 grams of BCAAs each week. You are thinking of combining Xtend and Gainz to provide you with the required nutrients. How many servings of each should you combine to obtain a week's supply that meets your trainer's specifications at the least cost? (If an answer does not exist, enter DNE.) servings of xtend servings of gainzarrow_forwardI need help with this problem and an explanation of the solution for the image described below. (Statistics: Engineering Probabilities)arrow_forward
 Glencoe Algebra 1, Student Edition, 9780079039897...AlgebraISBN:9780079039897Author:CarterPublisher:McGraw Hill
 Big Ideas Math A Bridge To Success Algebra 1: Stu...AlgebraISBN:9781680331141Author:HOUGHTON MIFFLIN HARCOURTPublisher:Houghton Mifflin Harcourt
 Functions and Change: A Modeling Approach to Coll...AlgebraISBN:9781337111348Author:Bruce Crauder, Benny Evans, Alan NoellPublisher:Cengage Learning
 Linear Algebra: A Modern IntroductionAlgebraISBN:9781285463247Author:David PoolePublisher:Cengage Learning