Concept explainers
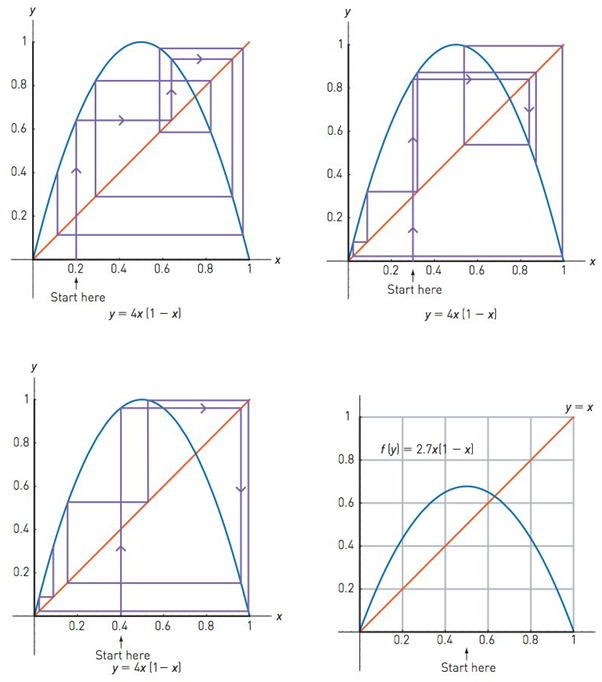
Cobweb plots (ExH). Here we visualize the simplified version of the Verhuist equation as we’ve seen in Mindscapes 24 and 25. That is, we consider the equation
We can visualize this repeated process on the graph of our sad parabola by first drawing in the diagonal line,

Notice how different the paths look! The Heart of Mathematics Web site contains a program that allows you to see this repeated process for any starting value of x.
These paths are called cobweb plots. The cobweb plot records the results of a repeatedly applied transformation-namely, taking a value for x, applying the formula to find y, then taking that result as the next x and again applying the formula to find the next y, and so on.
Now consider the graph of
Want to see the full answer?
Check out a sample textbook solution
Chapter 7 Solutions
HEART OF MATHEMATICS
Additional Math Textbook Solutions
Basic Business Statistics, Student Value Edition
Thinking Mathematically (6th Edition)
Probability And Statistical Inference (10th Edition)
University Calculus: Early Transcendentals (4th Edition)
Introductory Statistics
Elementary Statistics (13th Edition)
- Please refer belowarrow_forwardHi, can you guys help me with this? Thank you! Can you guys help me calculate again the Term GPA, Combined GPA, Cumulative GPA, Transfer GPA & Combined Cumulative GPA section? It's just not right right now. Here's the transfer totals point that I want to provide just in case you guys may ask where I get these from:arrow_forwardUse undetermined coefficients to find the particular solution to y"-3y+2y=4e3 Y(t) =arrow_forward
- Please refer belowarrow_forwardUse undetermined coefficients to find the particular solution to y"-y+5y = 7t² +61 +3 Yp(t) =arrow_forwardConsider the initial value problem y"+y'-12y= 0, y(0) = a, y'(0) = 4 Find the value of a so that the solution to the initial value problem approaches zero as too a =arrow_forward
- Consider the initial value problem y"+y'-12y= 0, y(0) = a, y'(0) = 4 Find the value of a so that the solution to the initial value problem approaches zero as too a =arrow_forwardPlease refer belowarrow_forwardThe 173 acellus.com StudentFunctions inter ooks 24-25/08 R Mastery Connect ac ?ClassiD-952638111# Introduction - Surface Area of Composite Figures 3 cm 3 cm 8 cm 8 cm Find the surface area of the composite figure. 2 SA = [?] cm² 7 cm REMEMBER! Exclude areas where complex shapes touch. 7 cm 12 cm 10 cm might ©2003-2025 International Academy of Science. All Rights Reserved. Enterarrow_forward
- Algebra & Trigonometry with Analytic GeometryAlgebraISBN:9781133382119Author:SwokowskiPublisher:Cengage
 Elementary Geometry For College Students, 7eGeometryISBN:9781337614085Author:Alexander, Daniel C.; Koeberlein, Geralyn M.Publisher:Cengage,
 Holt Mcdougal Larson Pre-algebra: Student Edition...AlgebraISBN:9780547587776Author:HOLT MCDOUGALPublisher:HOLT MCDOUGAL
  Algebra: Structure And Method, Book 1AlgebraISBN:9780395977224Author:Richard G. Brown, Mary P. Dolciani, Robert H. Sorgenfrey, William L. ColePublisher:McDougal Littell
 Elementary AlgebraAlgebraISBN:9780998625713Author:Lynn Marecek, MaryAnne Anthony-SmithPublisher:OpenStax - Rice University
 College Algebra (MindTap Course List)AlgebraISBN:9781305652231Author:R. David Gustafson, Jeff HughesPublisher:Cengage Learning


