
Videos
MTV. You’ve become a rock star and consequently feel that there can never be too many of you. So you make a video of infinitely many appearances of yourself. Do it! Arrange a TV, a video camera, and yourself as described in
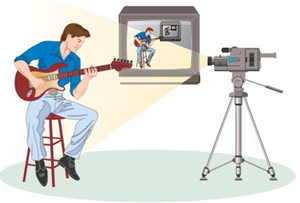
“Example 2-Video Feedback” (page 467) to produce a picture of infinitely many copies of yourself and your guitar admiring infinitely many copies of yourself and your guitar. If you have a decent voice, you can sing on the video; otherwise, call Milli Vanilli.
Want to see the full answer?
Check out a sample textbook solution
Chapter 7 Solutions
HEART OF MATHEMATICS
Additional Math Textbook Solutions
A First Course in Probability (10th Edition)
Calculus: Early Transcendentals (2nd Edition)
College Algebra (7th Edition)
A Problem Solving Approach To Mathematics For Elementary School Teachers (13th Edition)
Calculus for Business, Economics, Life Sciences, and Social Sciences (14th Edition)


- Examine the Variables: Carefully review and note the names of all variables in the dataset. Examples of these variables include: Mileage (mpg) Number of Cylinders (cyl) Displacement (disp) Horsepower (hp) Research: Google to understand these variables. Statistical Analysis: Select mpg variable, and perform the following statistical tests. Once you are done with these tests using mpg variable, repeat the same with hp Mean Median First Quartile (Q1) Second Quartile (Q2) Third Quartile (Q3) Fourth Quartile (Q4) 10th Percentile 70th Percentile Skewness Kurtosis Document Your Results: In RStudio: Before running each statistical test, provide a heading in the format shown at the bottom. “# Mean of mileage – Your name’s command” In Microsoft Word: Once you've completed all tests, take a screenshot of your results in RStudio and paste it into a Microsoft Word document. Make sure that snapshots are very clear. You will need multiple snapshots. Also transfer these results to the…arrow_forwardQ4*) (make sure you first understand question P5) Discuss the extremisation of the integral I = = √(2(y + 2) ³y' + (x − 7)) c You may find point (iv) in § 3.5 relevant. dx.arrow_forwardQ6*) Describe the plane paths of light in the two-dimensional media in which the light velocities are given respectively by (a) c = a/y, (b) c = a/√y, where a > 0, y > 0.arrow_forward
- Data Analysis DeltaMath Student Applical X Home $i$ Grades and Attendance x ent/3903821/26770486/bae6d3c1493d9868572f4878b5c163b6 y School St... Quizez And Tests Cancer reserch College Reserch Highschool Reserch Writing SCP Step Reason Statement ADBC 1 Given AD || BC 2 ACCA Reflexive Property try Type of Statement C B +> D A Feb 14arrow_forwardlim 1 x→0x3 3 So²² 6 tln(1+t) t4 +4 .dt 2arrow_forward2. Suppose the population of Wakanda t years after 2000 is given by the equation f(t) = 45000(1.006). If this trend continues, in what year will the population reach 50,000 people? Show all your work, round your answer to two decimal places, and include units. (4 points)arrow_forward
- 3. Solve the equation, give the answer exactly (no calculator approximations), and show all your work. (4 points) log5 2x = 3arrow_forwardExamine the Variables: Carefully review and note the names of all variables in the dataset. Examples of these variables include: Mileage (mpg) Number of Cylinders (cyl) Displacement (disp) Horsepower (hp) Research: Google to understand these variables. Statistical Analysis: Select mpg variable, and perform the following statistical tests. Once you are done with these tests using mpg variable, repeat the same with hp Mean Median First Quartile (Q1) Second Quartile (Q2) Third Quartile (Q3) Fourth Quartile (Q4) 10th Percentile 70th Percentile Skewness Kurtosis Document Your Results: In RStudio: Before running each statistical test, provide a heading in the format shown at the bottom. “# Mean of mileage – Your name’s command” In Microsoft Word: Once you've completed all tests, take a screenshot of your results in RStudio and paste it into a Microsoft Word document. Make sure that snapshots are very clear. You will need multiple snapshots. Also transfer these results to the…arrow_forwardIf given is the graph of f(x), then how does the graph of modulus of f(x) will look like(roughly)?arrow_forward
- pls helparrow_forwardLet I = f(x) dx, where f is the function whose graph is shown. 4 2 y f X 1 2 3 4 (a) Use the graph to find L2, R2 and M2. R₂ M2 = = = (b) Are these underestimates or overestimates of I? O 42 is an underestimate. O 42 is an overestimate. ◇ R2 is an underestimate. OR2 is an overestimate. OM2 is an underestimate. ○ M2 is an overestimate. (c) Use the graph to find T2. T₂ =arrow_forwardExamine the Variables: Carefully review and note the names of all variables in the dataset. Examples of these variables include: Mileage (mpg) Number of Cylinders (cyl) Displacement (disp) Horsepower (hp) Research: Google to understand these variables. Statistical Analysis: Select mpg variable, and perform the following statistical tests. Once you are done with these tests using mpg variable, repeat the same with hp Mean Median First Quartile (Q1) Second Quartile (Q2) Third Quartile (Q3) Fourth Quartile (Q4) 10th Percentile 70th Percentile Skewness Kurtosis Document Your Results: In RStudio: Before running each statistical test, provide a heading in the format shown at the bottom. “# Mean of mileage – Your name’s command” In Microsoft Word: Once you've completed all tests, take a screenshot of your results in RStudio and paste it into a Microsoft Word document. Make sure that snapshots are very clear. You will need multiple snapshots. Also transfer these results to the…arrow_forward
 Elementary Geometry for College StudentsGeometryISBN:9781285195698Author:Daniel C. Alexander, Geralyn M. KoeberleinPublisher:Cengage Learning
 Mathematics For Machine TechnologyAdvanced MathISBN:9781337798310Author:Peterson, John.Publisher:Cengage Learning,
 Big Ideas Math A Bridge To Success Algebra 1: Stu...AlgebraISBN:9781680331141Author:HOUGHTON MIFFLIN HARCOURTPublisher:Houghton Mifflin Harcourt