
Videos
Sports: Surfing In Hawaii, January is a favorite month for surfing since 60% of the days have a surf of at least 6 feet (Reference: Hawaii Data Book, Robert C. Schmitt). You work day shifts in a Honolulu hospital emergency room. At the beginning of each month you select your days off, and you pick 7 days at random in January to go surfing. Let r be the number of days the surf is at least 6 feet.
(a) Make a histogram of the
(b) What is the probability of getting 5 or more days when the surf is at least 6 feet?
(c) What is the probability of getting fewer than 3 days when the surf is at least 6 feet?
(d) What is the expected number of days when the surf will be at least 6 feet?
(e) What is the standard deviation of the r-probability distribution?
(d) Interpretation Can you be fairly confident that the surf will be at least 6 feet high on one of your days off? Explain.
(a)
To graph: The histogram.
Explanation of Solution
Given: 60% of the days in January have a surf height of at least 6 feet and the number of days randomly picked in January is 7.
Graph:
According to the provided details, the number of days the surf is at least 6 feet high, r follows the binomial distribution with the probability of success in a single trial (p) is 0.60 and the number of trials (n) are 7.
Consider, the probability values provided in Table 2 of the appendix for
The probability values for
Follow the steps given below to obtain the histogram:
Step 1: Place the values of r- 0, 1, 2, 3, 4, 5, 6, and 7 on the horizontal axis.
Step 2: Place the values of
Step 3: Construct a bar over each of the r values (0, 1, 2, 3, 4, 5, 6, 7) ranging from
The histogram for the binomial distribution for
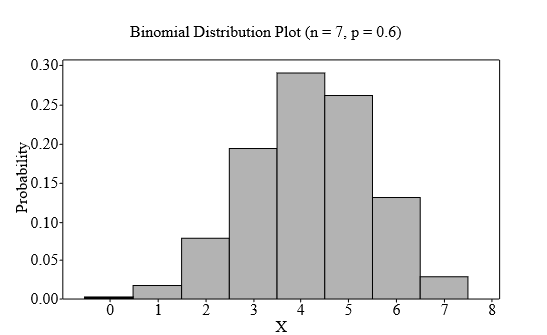
Interpretation: The graph above displays the fact that the binomial distribution having
(b)
To find: The probability of getting 5 or more days when the surf is at least 6 feet high.
Answer to Problem 11P
Solution: The probability is 0.420.
Explanation of Solution
Given: The provided values are:
Calculation: The random variable ‘r’ follows the binomial distribution with the parameters,
The probability of getting 5 or more days when the surf is at least 6 feet high can be calculated by:
Consider, the probability values provided in the Table 2 of the appendix for
The probability values for
Substitute the values in the above formula,
The required probability is 0.420.
Interpretation: There is a 42% chance of getting 5 or more days when the surf is at least 6 feet high.
(c)
To find: The probability of getting fewer than 3 days when the surf is at least 6 feet high.
Answer to Problem 11P
Solution: The probability is 0.096.
Explanation of Solution
Given: The provided values are:
Calculation: The random variable ‘r’ follows the binomial distribution with the parameters
The probability of getting fewer than 3 days when the surf is at least 6 feet high can be calculated by:
Consider, the probability values provided in the Table 2 of the appendix for
The probability values for
Substitute the values in the above formula. Thus,
The required probability is 0.096.
Interpretation: There is a 9.6% chance of getting fewer than 3 days when the surf is at least 6 feet high.
(d)
To find: The expected number of days when the surf will be at least 6 feet high.
Answer to Problem 11P
Solution: The expected value is 4.2.
Explanation of Solution
Given: The provided values are:
Calculation: The random variable ‘r’ follows the binomial distribution with the parameters,
The formula that is used to calculate the expected value of the binomial distribution is:
Substitute the provided values in the above formula,
The expected value is 4.2.
Interpretation: One can expect 4.2 out of 7 days when the surf will be at least 6 feet high.
(e)
To find: The standard deviation of the r-distribution.
Answer to Problem 11P
Solution: The standard deviation is 1.296.
Explanation of Solution
Given: The provided values are:
Calculation: The random variable ‘r’ follows the binomial distribution with the parameters,
The formula that is used to calculate the standard deviation of the binomial distribution is:
Substitute the provided values in the above formula,
The standard deviation is 1.296.
Interpretation: The standard deviation of the probability distribution of r is 1.296.
(f)
To explain: Whether one can be fairly confident that the surf will be at least 6 feet high on one of your days off.
Answer to Problem 11P
Solution: Yes, one can be fairly confident as the expected number of days the surf will be at least 6 feet high is 4. The probability of getting at least 1 day out of 7 during which the surf will be at least 6 feet high is 0.998.
Explanation of Solution
Given: The provided values are:
Calculation: The random variable ‘r’ follows the binomial distribution with the parameters,
The probability of getting at least 1 day out of 7 during which the surf will be at least 6 feet high can be calculated by:
Consider, the probability values provided in Table 2 of the appendix for
The probability value for
Substitute the values in the above formula. Thus,
The probability is 0.998.
Interpretation: The expected number of days that the surf will be at least 6 feet high is approximately 4 and there is a 99.8% chance of getting a surf that is at least 6 feet high on one of the days off out of 7 days. So, one can be confident of getting it.
Want to see more full solutions like this?
Chapter 6 Solutions
Understanding Basic Statistics


- An electronics company manufactures batches of n circuit boards. Before a batch is approved for shipment, m boards are randomly selected from the batch and tested. The batch is rejected if more than d boards in the sample are found to be faulty. a) A batch actually contains six faulty circuit boards. Find the probability that the batch is rejected when n = 20, m = 5, and d = 1. b) A batch actually contains nine faulty circuit boards. Find the probability that the batch is rejected when n = 30, m = 10, and d = 1.arrow_forwardTwenty-eight applicants interested in working for the Food Stamp program took an examination designed to measure their aptitude for social work. A stem-and-leaf plot of the 28 scores appears below, where the first column is the count per branch, the second column is the stem value, and the remaining digits are the leaves. a) List all the values. Count 1 Stems Leaves 4 6 1 4 6 567 9 3688 026799 9 8 145667788 7 9 1234788 b) Calculate the first quartile (Q1) and the third Quartile (Q3). c) Calculate the interquartile range. d) Construct a boxplot for this data.arrow_forwardPam, Rob and Sam get a cake that is one-third chocolate, one-third vanilla, and one-third strawberry as shown below. They wish to fairly divide the cake using the lone chooser method. Pam likes strawberry twice as much as chocolate or vanilla. Rob only likes chocolate. Sam, the chooser, likes vanilla and strawberry twice as much as chocolate. In the first division, Pam cuts the strawberry piece off and lets Rob choose his favorite piece. Based on that, Rob chooses the chocolate and vanilla parts. Note: All cuts made to the cake shown below are vertical.Which is a second division that Rob would make of his share of the cake?arrow_forward
- Three players (one divider and two choosers) are going to divide a cake fairly using the lone divider method. The divider cuts the cake into three slices (s1, s2, and s3). If the choosers' declarations are Chooser 1: {s1 , s2} and Chooser 2: {s2 , s3}. Using the lone-divider method, how many different fair divisions of this cake are possible?arrow_forwardTheorem 2.6 (The Minkowski inequality) Let p≥1. Suppose that X and Y are random variables, such that E|X|P <∞ and E|Y P <00. Then X+YpX+Yparrow_forwardTheorem 1.2 (1) Suppose that P(|X|≤b) = 1 for some b > 0, that EX = 0, and set Var X = 0². Then, for 0 0, P(X > x) ≤e-x+1²² P(|X|>x) ≤2e-1x+1²² (ii) Let X1, X2...., Xn be independent random variables with mean 0, suppose that P(X ≤b) = 1 for all k, and set oσ = Var X. Then, for x > 0. and 0x) ≤2 exp Σ k=1 (iii) If, in addition, X1, X2, X, are identically distributed, then P(S|x) ≤2 expl-tx+nt²o).arrow_forward
- Theorem 5.1 (Jensen's inequality) state without proof the Jensen's Ineg. Let X be a random variable, g a convex function, and suppose that X and g(X) are integrable. Then g(EX) < Eg(X).arrow_forwardCan social media mistakes hurt your chances of finding a job? According to a survey of 1,000 hiring managers across many different industries, 76% claim that they use social media sites to research prospective candidates for any job. Calculate the probabilities of the following events. (Round your answers to three decimal places.) answer parts a-c. a) Out of 30 job listings, at least 19 will conduct social media screening. b) Out of 30 job listings, fewer than 17 will conduct social media screening. c) Out of 30 job listings, exactly between 19 and 22 (including 19 and 22) will conduct social media screening. show all steps for probabilities please. answer parts a-c.arrow_forwardQuestion: we know that for rt. (x+ys s ا. 13. rs. and my so using this, show that it vye and EIXI, EIYO This : E (IX + Y) ≤2" (EIX (" + Ely!")arrow_forward
- Theorem 2.4 (The Hölder inequality) Let p+q=1. If E|X|P < ∞ and E|Y| < ∞, then . |EXY ≤ E|XY|||X|| ||||qarrow_forwardTheorem 7.6 (Etemadi's inequality) Let X1, X2, X, be independent random variables. Then, for all x > 0, P(max |S|>3x) ≤3 max P(S| > x). Isk≤narrow_forwardTheorem 7.2 Suppose that E X = 0 for all k, that Var X = 0} x) ≤ 2P(S>x 1≤k≤n S√2), -S√2). P(max Sk>x) ≤ 2P(|S|>x- 1arrow_forwardarrow_back_iosSEE MORE QUESTIONSarrow_forward_ios
 Glencoe Algebra 1, Student Edition, 9780079039897...AlgebraISBN:9780079039897Author:CarterPublisher:McGraw Hill
 Holt Mcdougal Larson Pre-algebra: Student Edition...AlgebraISBN:9780547587776Author:HOLT MCDOUGALPublisher:HOLT MCDOUGAL
 Algebra: Structure And Method, Book 1AlgebraISBN:9780395977224Author:Richard G. Brown, Mary P. Dolciani, Robert H. Sorgenfrey, William L. ColePublisher:McDougal Littell
 Big Ideas Math A Bridge To Success Algebra 1: Stu...AlgebraISBN:9781680331141Author:HOUGHTON MIFFLIN HARCOURTPublisher:Houghton Mifflin Harcourt
 College Algebra (MindTap Course List)AlgebraISBN:9781305652231Author:R. David Gustafson, Jeff HughesPublisher:Cengage Learning