Concept explainers
Videos
Temperature and pH Effects. Figure 6-4 illustrates enzyme activities as functions of temperature and pH. In general, the activity of a specific enzyme is highest at the temperature and pH that are characteristic of the environment in which the enzyme normally functions.
- (a) Explain the shapes of the curves in Figure 6-4 in terms of the major chemical or physical factors that affect enzyme activity.
- (b) For each enzyme in Figure 6-4, suggest the adaptive advantage of having the enzyme activity profile shown in the figure.
- (c) Some enzymes have a very flat pH profile—that is, they have essentially the same activity over a broad pH range. How might you explain this observation?
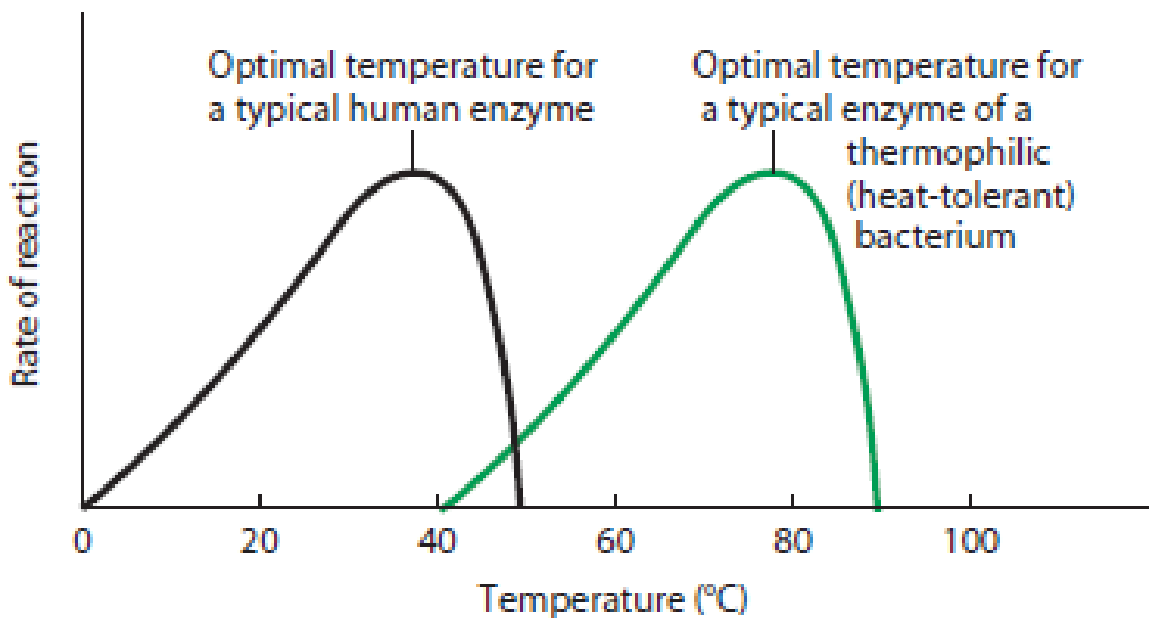
(a) Temperature dependence. The reaction rate for both a typical human enzyme (black) and a typical enzyme from a thermophilic bacterium (green) varies with temperature. It is highest at the optimal temperature, which is about 37°C (body temperature) for the human enzyme and about 75°C (the temperature of a typical hot spring) for the bacterial enzyme. Above the optimal temperature, the enzyme is rapidly inactivated by denaturation.
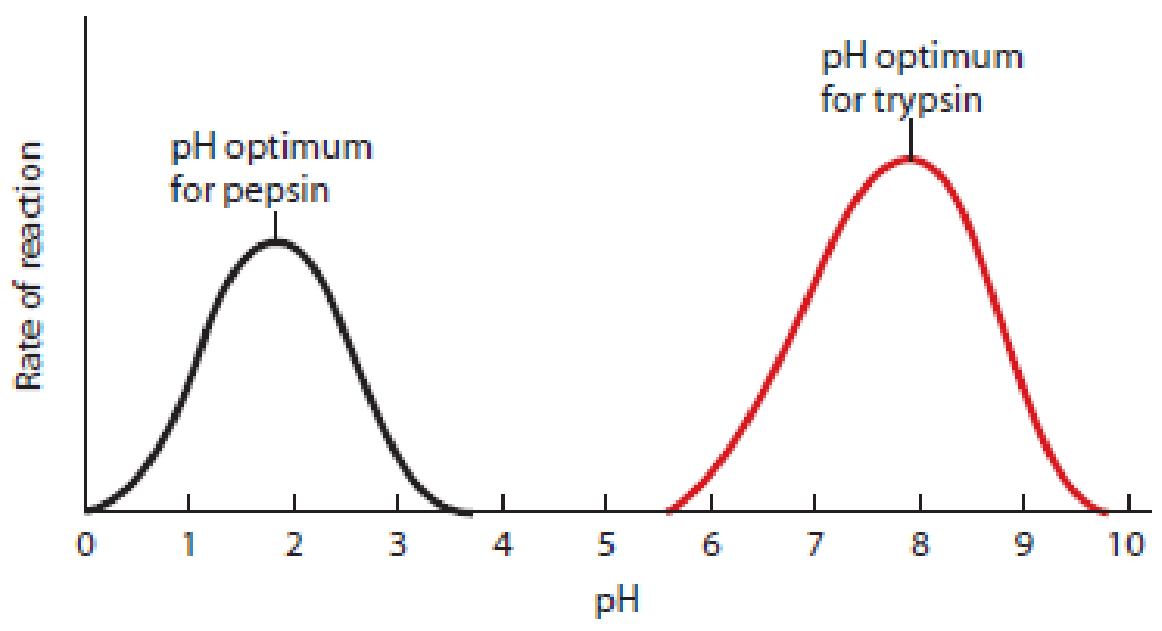
(b) pH dependence. The reaction rate of an enzyme is highest at its optimal pH, which is about 2.0 for pepsin (stomach pH) and near 8.0 for trypsin (intestinal pH). At the pH optimum for an enzyme, ionizable groups on both the enzyme and the substrate molecules are in the most favorable form for reactivity.
Figure 6-4 The Effect of Temperature and pH on the Reaction Rate of Enzyme-Catalyzed Reactions. Every enzyme has an optimum temperature and pH that usually reflect the environment where that enzyme is found in nature.
Want to see the full answer?
Check out a sample textbook solution
Chapter 6 Solutions
Becker's World of the Cell (9th Edition)


- Identify the indicated tissue? (stem x.s.) parenchyma collenchyma sclerenchyma ○ xylem ○ phloem none of thesearrow_forwardWhere did this structure originate from? (Salix branch root) epidermis cortex endodermis pericycle vascular cylinderarrow_forwardIdentify the indicated tissue. (Tilia stem x.s.) parenchyma collenchyma sclerenchyma xylem phloem none of thesearrow_forward
- Identify the indicated structure. (Cucurbita stem l.s.) pit lenticel stomate tendril none of thesearrow_forwardIdentify the specific cell? (Zebrina leaf peel) vessel element sieve element companion cell tracheid guard cell subsidiary cell none of thesearrow_forwardWhat type of cells flank the opening on either side? (leaf x.s.) vessel elements sieve elements companion cells tracheids guard cells none of thesearrow_forward
- What specific cell is indicated. (Cucurbita stem I.s.) vessel element sieve element O companion cell tracheid guard cell none of thesearrow_forwardWhat specific cell is indicated? (Aristolochia stem x.s.) vessel element sieve element ○ companion cell O O O O O tracheid O guard cell none of thesearrow_forwardIdentify the tissue. parenchyma collenchyma sclerenchyma ○ xylem O phloem O none of thesearrow_forward
- Please answer q3arrow_forwardRespond to the following in a minimum of 175 words: How might CRISPR-Cas 9 be used in research or, eventually, therapeutically in patients? What are some potential ethical issues associated with using this technology? Do the advantages of using this technology outweigh the disadvantages (or vice versa)? Explain your position.arrow_forwardYou are studying the effect of directional selection on body height in three populations (graphs a, b, and c below). (a) What is the selection differential? Show your calculation. (2 pts) (b) Which population has the highest narrow sense heritability for height? Explain your answer. (2 pts) (c) If you examined the offspring in the next generation in each population, which population would have the highest mean height? Why? (2 pts) (a) Midoffspring height (average height of offspring) Short Short Short Short (c) Short (b) Short Tall Short Tall Short Short Tall Midparent height (average height of Mean of population = 65 inches Mean of breading parents = 70 inches Mean of population = 65 inches Mean of breading parents = 70 inches Mean of population = 65 inches Mean of breading parents = 70 inchesarrow_forward
 Biology 2eBiologyISBN:9781947172517Author:Matthew Douglas, Jung Choi, Mary Ann ClarkPublisher:OpenStax
 BiochemistryBiochemistryISBN:9781305577206Author:Reginald H. Garrett, Charles M. GrishamPublisher:Cengage Learning
 BiochemistryBiochemistryISBN:9781305961135Author:Mary K. Campbell, Shawn O. Farrell, Owen M. McDougalPublisher:Cengage Learning
 Biology: The Dynamic Science (MindTap Course List)BiologyISBN:9781305389892Author:Peter J. Russell, Paul E. Hertz, Beverly McMillanPublisher:Cengage Learning
 Biology (MindTap Course List)BiologyISBN:9781337392938Author:Eldra Solomon, Charles Martin, Diana W. Martin, Linda R. BergPublisher:Cengage Learning
 Anatomy & PhysiologyBiologyISBN:9781938168130Author:Kelly A. Young, James A. Wise, Peter DeSaix, Dean H. Kruse, Brandon Poe, Eddie Johnson, Jody E. Johnson, Oksana Korol, J. Gordon Betts, Mark WomblePublisher:OpenStax College