
Concept explainers
Videos
Determining the effect of
Three different companies each purchased trucks on January 1, 2018, for $50,000. Each truck was expected to last four years or 200,000 miles. Salvage value was estimated to be $5,000. All three trucks were driven 66,000 miles in 2018, 42,000 miles in 2019, 40,000 miles in 2020, and 60,000 miles in 2021. Each of the three companies earned $40,000 of cash revenue during each of the four years. Company A uses straight-line depreciation, company B uses double-declining-balance depreciation, and company C uses units-of-production depreciation.
Required
Answer each of the following questions. Ignore the effects of income taxes.
a. Which company will report the highest amount of net income for 2018?
b. Which company will report the lowest amount of net income for 2021?
c. Which company will report the highest book value on the December 31, 2020,
d. Which company will report the highest amount of
e. Which company will report the lowest amount of cash flow from operating activities on the 2020 statement of
a.
Identify the company which will report the highest amount of net income for 2018.
Explanation of Solution
Net Income
Net income is the sum total of all the revenues generated in a particular accounting period after deducting cost of goods sold and expenses and losses, such as rent expense, depreciation of that particular accounting period.
Book value:
The amount of acquisition cost of less accumulated depreciation as on a particular date is referred to as book value.
Formula for book value:
Accumulated depreciation:
The total amount of depreciation expense deducted, from the time asset acquired till date, as reported in the account as on a particular date, is referred to as accumulated depreciation.
Formula for accumulated depreciation:
Identify the company which will report the highest amount of net income for 2018.
| Net Income for 2018 | |||
| Company A (in $) | Company B (in $) | Company C (in $) | |
| Revenue | 40,000 | 40,000 | 40,000 |
| Less: Depreciation expense |
11,250 (W.N. 1) |
25,000 (W.N. 2) |
14,850 (W.N. 3) |
| Net Income | $28,750 | $15,000 | $25,150 |
Table (1)
Working Note 1:
Prepare depreciation schedule under straight-line method for Company A.
| Date | Depreciable Cost (in $) (A) | Depreciation Rate (B) | Depreciation expense (in $) |
| 2018 | 45,000 | 1/4 | 11,250 |
| 2019 | 45,000 | 1/4 | 11,250 |
| 2020 | 45,000 | 1/4 | 11,250 |
| 2021 | 45,000 | 1/4 | 11,250 |
Table (2)
Note:
- 1. Calculate the depreciable cost.
Working note 2:
Prepare depreciation schedule under double-declining-balance (DDB) method for Company B.
| Date | Double-Declining-Balance Depreciation Rate (A) | Book Value (Refer note) (in $) (B) | Depreciation expense (in $) |
| 2018 | 0.50 | 50,000 | 25,000 |
| 2019 | 0.50 | 25,000 | 12,500 |
| 2020 | 0.50 | 12,500 | 6,250 |
| 2021 | 0.50 | 6,250 | 1,250 |
Table (3)
Note:
- 1. Determine the depreciation rate applied each year.
Useful life = 4 years
- 2. Compute depreciation expense on 2021.
Working note 3:
Prepare depreciation schedule under units-of-production method for Company C.
| Date | Depreciation per unit (A) | Number of miles (B) | Depreciation expense (in $) |
| 2018 | $0.225 | 66,000 | 14,850 |
| 2019 | $0.225 | 42,000 | 9,450 |
| 2020 | $0.225 | 40,000 | 9,000 |
| 2021 | $0.225 | 60,000 | 11,700 |
Table (4)
Note:
- 1. Compute depreciation per unit.
- 2. Compute depreciation expense on 2021.
Hence, the company which will report the highest amount of net income for 2018 is Company A.
b.
Identify the company which will report the lowest amount of net income for 2021.
Explanation of Solution
Identify the company which will report the lowest amount of net income for 2021.
| Net Income for 2021 | |||
| Company A (in $) | Company B (in $) | Company C (in $) | |
| Revenue | 40,000 | 40,000 | 40,000 |
| Less: Depreciation expense |
11,250 (W.N. 4) |
1,250 (W.N. 5) |
11,700 (W.N. 6) |
| Net Income | $28,750 | $38,750 | $28,300 |
Table (5)
Working Note 4:
Prepare depreciation schedule under straight-line method for Company A.
| Date | Depreciable Cost (in $) (A) | Depreciation Rate (B) | Depreciation expense (in $) |
| 2018 | 45,000 | 1/4 | 11,250 |
| 2019 | 45,000 | 1/4 | 11,250 |
| 2020 | 45,000 | 1/4 | 11,250 |
| 2021 | 45,000 | 1/4 | 11,250 |
Table (6)
Note:
Calculate the depreciable cost.
Working note 5:
Prepare depreciation schedule under double-declining-balance (DDB) method for Company B.
| Date | Double-Declining-Balance Depreciation Rate (A) | Book Value (Refer note) (in $) (B) | Depreciation expense (in $) |
| 2018 | 0.50 | 50,000 | 25,000 |
| 2019 | 0.50 | 25,000 | 12,500 |
| 2020 | 0.50 | 12,500 | 6,250 |
| 2021 | 0.50 | 6,250 | 1,250 |
Table (7)
Note:
- 1. Determine the depreciation rate applied each year.
Useful life = 4 years
- 2. Compute depreciation expense on 2021.
Working note 6:
Prepare depreciation schedule under units-of-production method for Company C.
| Date | Depreciation per unit (A) | Number of miles (B) | Depreciation expense (in $) |
| 2018 | $0.225 | 66,000 | 14,850 |
| 2019 | $0.225 | 42,000 | 9,450 |
| 2020 | $0.225 | 40,000 | 9,000 |
| 2021 | $0.225 | 60,000 | 11,700 |
Table (8)
Note:
- 1. Compute depreciation per unit.
- 2. Compute depreciation expense on 2021.
Hence, the company which will report the lowest amount of net income for 2021 is Company C.
c.
Identify the company which will report the highest book value on the December 31, 2020, balance sheet.
Explanation of Solution
Book value:
The amount of acquisition cost of less accumulated depreciation as on a particular date is referred to as book value.
Formula for book value:
Identify the company which will report the highest book value on the December 31, 2020, balance sheet.
| Book value on December 31, 2020 | |||
| Company A (in $) | Company B (in $) | Company C (in $) | |
| Cost | 50,000 | 50,000 | 50,000 |
| Less: Accumulated depreciation |
33,750 (W.N. 7) |
43,750 (W.N. 8) |
33,300 (W.N. 9) |
| Book value | $16,250 | $6,250 | $16,700 |
Table (9)
Working note 7:
Prepare depreciation schedule under straight-line method for Company A.
| Date | Depreciable Cost (in $) (A) | Depreciation Rate (B) | Depreciation expense (in $) | Accumulated Depreciation (in $) |
| 2018 | 45,000 | 1/4 | 11,250 | 11,250 |
| 2019 | 45,000 | 1/4 | 11,250 | 22,500 |
| 2020 | 45,000 | 1/4 | 11,250 | 33,750 |
Table (10)
Note:
Calculate the depreciable cost.
Working note 8:
Prepare depreciation schedule under double-declining-balance (DDB) method for Company B.
| Date | Double-Declining-Balance Depreciation Rate (A) | Book Value (Refer note) (in $) (B) | Depreciation expense (in $) | Accumulated Depreciation (in $) |
| 2018 | 0.50 | 50,000 | 25,000 | 25,000 |
| 2019 | 0.50 | 25,000 | 12,500 | 37,500 |
| 2020 | 0.50 | 12,500 | 6,250 | 43,750 |
Table (11)
Note:
Determine the depreciation rate applied each year.
Useful life = 4 years
Working note 9:
Prepare depreciation schedule under units-of-production method for Company C.
| Date | Depreciation per unit (A) | Number of miles (B) | Depreciation expense (in $) | Accumulated Depreciation (in $) |
| 2018 | $0.225 | 66,000 | 14,850 | 14,850 |
| 2019 | $0.225 | 42,000 | 9,450 | 24,300 |
| 2020 | $0.225 | 40,000 | 9,000 | 33,300 |
Table (12)
Note:
Compute depreciation per unit.
Hence, the company which will report the highest book value on the December 31, 2020, balance sheet is Company C.
d.
Identify the company which will report the highest amount of retained earnings on the December 31, 2021, balance sheet.
Explanation of Solution
Retained earnings:
The retained earnings statement is that financial statement which shows the amount of net income which is actually retained by the Company on a particular date. These earnings can be utilized by the Company for the reinvestment and to pay its debts.
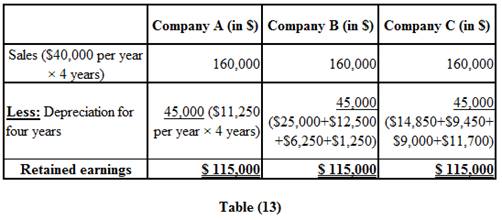
Hence, the retained earnings for all the companies are the same on the December 31, 2021, balance sheet, as the total depreciation over the four year period is the same for all the three companies.
e.
Identify the company which will report the lowest amount of cash flow from operating activities on the 2020 statement of cash flows.
Explanation of Solution
Statement of cash flows:
This statement reports all the cash transactions which are responsible for inflow and outflow of cash, and result of these transactions is reported as ending balance of cash at the end of reported period.
Cash flows from operating activities:
These refer to the cash received or cash paid in day-to-day operating activities of a company. In this direct method, cash flow from operating activities is computed by using all cash receipts and cash payments during the year.
Depreciation expense is not a cash outflow item. If the income tax is not considered, all the three companies will report the same amount of cash flow from operating activities on the 2020 statement of cash flows.
Want to see more full solutions like this?
Chapter 6 Solutions
Survey Of Accounting


- The ending inventory isarrow_forwardhelparrow_forwardBansai, age 66, retires and receives a $1,450 per month annuity from his employer's qualified pension plan. Bansai made $87,600 of after-tax contributions to the plan before retirement. Under the simplified method, Bansai's number of anticipated payments is 240. What is the amount includible in income in the first year of withdrawals assuming 12 monthly payments? A. $10,560 B. $12,540 C. $17,400 D. $8,220arrow_forward
 Principles of Accounting Volume 1AccountingISBN:9781947172685Author:OpenStaxPublisher:OpenStax College
 College Accounting, Chapters 1-27AccountingISBN:9781337794756Author:HEINTZ, James A.Publisher:Cengage Learning,
 Intermediate Accounting: Reporting And AnalysisAccountingISBN:9781337788281Author:James M. Wahlen, Jefferson P. Jones, Donald PagachPublisher:Cengage Learning
 EBK CONTEMPORARY FINANCIAL MANAGEMENTFinanceISBN:9781337514835Author:MOYERPublisher:CENGAGE LEARNING - CONSIGNMENT