Videos
Milk Production The data in the table below represent the number of dairy farms (in thousands) and the amount of milk produced (in billions of pounds) in the United States for various years.
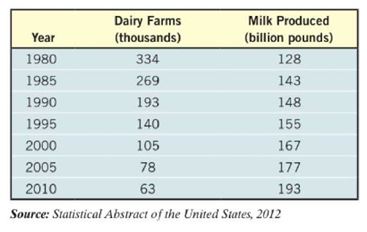
(a) Using a graphing utility, draw a
(b) Using a graphing utility, build a logarithmic model from the data.
(c) Graph the logarithmic function found in part (b) on the scatter diagram.
(d) In 2008, there were 67 thousand dairy farms in the United States. Use the function in part (b) to predict the amount of milk produced in 2008.
(e) The actual amount of milk produced in 2008 was 190 billion pounds. How does your prediction in part (d) compare to this?
Want to see the full answer?
Check out a sample textbook solution
Chapter 5 Solutions
Precalculus Enhanced with Graphing Utilities, Books a la Carte Edition Plus NEW MyLab Math -- Access Card Package (7th Edition)


- What is the relationship between AdoMian decompoition method and homotopy Perturaba tion method with prove?arrow_forward21/solve the following differential equation Using laplace transform y₁ =-y, Y₁(0)=1 y' = Y Y₂(0)=0 2 21 Solve the following equations: dy 1- dt + 2y + = ydt 2 cost, y(0) = 1 2 2- y(t) = ±² + (yet) sin (t-u) du Q3: Answer the following: 1- L [Log Sa] (5²+9²) 2- L1 [Log (Cos²y1] 0-25 3-L-1 [ -] 4- (5+1) 3 L (ezt sin3t) e-s 5- L-1 ( 너 (0) 5² +5arrow_forwardLESSON MATHEMATICS ACTIVITIES 1.3 DECIMALS 1. Josh used itres of ster during an Integrahed Express the ami remained DATE b) 14.07 2. Express 0.5 as a fraction in its simplest form or e) 327.034 7. Write the number form is e) 5.11x 10 ese standard 3. Express 0.145 os simplest form fraction in its b) 2.03x10² 4. In August 2022, the cost of a litre of petrol was Sh 159.25. How much did kipchoge pay for two litres? c) 6.3x10³ 5. A doctor prescribed 12.5 ml of a dr to a patient. Express the drug prescribed in litres to two significant figures 8. Work out: a) 2.05 5.2-1.8 rite each of the following in stand- ds form 0039 b)3.6 2.8 (2.8+0arrow_forward
- RK 119 43 Previous Problem University at Buffalo Problem List Next Problem Match the surfaces (a) - (f) below with the contour diagrams (1) - (6) below those. (a) Surface (a) matches contour 5 V V (b) Surface (b) matches contour 2 V (c) Surface (c) matches contour 1 (d) Surface (d) matches contour 6 V (e) Surface (e) matches contour 4 V (f) Surface (f) matches contour 3 V (4) (1) -0.25 (a) (b) (c) (d) (e) y y 2.5 0.5 1.5 1.5 1.5 y .3 0.25 OC 0.25 -0.25 (2) X 1.5 ZI (f) y 0.01 0.01 (3) ☑ X 0.01 0.01 0.2 0.2 (5) 0 x 0.5 (6) 0.25 X X 0.25 0.5arrow_forward43 University at Buffalo Previous Problem Problem List Next Problem At least one of the answers above is NOT correct. The figure shows a hill with two paths, A and B. (a) What is the elevation change along each path? 400 9400 ✓ feet (b) Which path ascends more rapidly? A v (c) On which path will you probably have a better view of the surrounding countryside (assuming that trees do not block your view)? A V (d) Along which path is there more likely to be a stream? A V Note: You can earn 50% partial credit for 2-3 correct answers. Preview My Answers Submit Answers Q hulu )))) 9800' A 10000 (Click on graph to enlarge) L ^ B 0 Logged in as Luella Ya 4)arrow_forwardfind the general soultion (D-DxDy-2Dx)Z = sin(3x+4y) + x²yarrow_forward
- dx Y+2 h dy x + Z " dz X+Z find three Soultion indeparedarrow_forwarddy Find for y = xetanh 3x + cosh 1 x²+10 dx Find S 1−sinh 2 x cosh x 2 dxarrow_forwarda) Sketch the y = cosh x, and indicate its properties. b) prove that sinh 2x = 2 sinh x coshx dx برهن for y=xetanh 3x + cosh¹ x² + 10 dy Find cosh x Find S dx 1-sinh 2 xarrow_forward
- Q2. Find the points on the ellipse x²+4y² = 1, where f(x, y) = xy has its extreme value. Q3. Find the moment of inertia about x-axis for the area bounded by the curves x = y² and x=2y-y2 if 8 = y + 1.(20 Mark) Q4 Find the iterated integral for the following then evaluate it: (20 Mark) -1/√2 y2 dxdy -1/√2 1-y2arrow_forwardQ8 Salve: f√coshx-i.dx do Solve: So Q₂ Qio Salve S Sinho + cosho dx 4-x2 Qll Solve Sdx √ex+1 Q12 If y = (x²+1). sech (lmx), and dy dx Q13 If y = /n | cschx + cothxl, Ind dyarrow_forwardIf y = /R/cschx + cothx|, 2nd dy 3) ans. aus. dy: x^" [ x² + x^ (1+/nx)/nx] dx + 252 cosh + + C ans. + 1 aims. aims. -2 csch'e ans. dy да = 2 12) ans. - cschx + A + Carrow_forward

 Algebra and Trigonometry (MindTap Course List)AlgebraISBN:9781305071742Author:James Stewart, Lothar Redlin, Saleem WatsonPublisher:Cengage Learning
 College AlgebraAlgebraISBN:9781305115545Author:James Stewart, Lothar Redlin, Saleem WatsonPublisher:Cengage Learning
 Algebra & Trigonometry with Analytic GeometryAlgebraISBN:9781133382119Author:SwokowskiPublisher:Cengage
 College Algebra (MindTap Course List)AlgebraISBN:9781305652231Author:R. David Gustafson, Jeff HughesPublisher:Cengage Learning
 Glencoe Algebra 1, Student Edition, 9780079039897...AlgebraISBN:9780079039897Author:CarterPublisher:McGraw Hill