Concept explainers
Videos
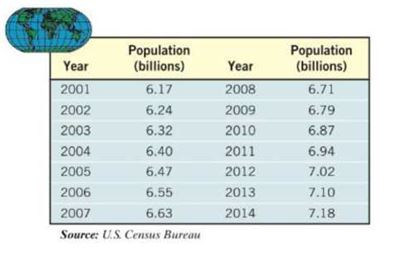
Population Model The data on the right represent the world population. An ecologist is interested in building a model that describes the world population.
(a) Using a graphing utility, draw a
(b) Using a graphing utility, build a logistic model from the data.
(c) Using a graphing utility, draw the function found in part (b) on the scatter diagram.
(d) Based on the function found in part (b), what is the carrying capacity of the world?
(e) Use the function found in part (b) to predict the population of the world in 2021.
(f) When will world population be 10 billion?
Want to see the full answer?
Check out a sample textbook solution
Chapter 5 Solutions
Precalculus Enhanced with Graphing Utilities, Books a la Carte Edition Plus NEW MyLab Math -- Access Card Package (7th Edition)


- Does the following table represent a linear function ? If so, find the linear equation that models the data.arrow_forwardThe number of people afflicted with the common cold in the winter months dropped steadily by 50 each yearsince 2004 until 2010. In 2004, 875 people were inflicted. Find the linear function that models the number of people afflicted with the common cold C as a function of theyear, t. When will no one be afflicted?arrow_forwardTable 6 shows the year and the number ofpeople unemployed in a particular city for several years. Determine whether the trend appears linear. If so, and assuming the trend continues, in what year will the number of unemployed reach 5 people?arrow_forward
- What is regression analysis? Describe the process of performing regression analysis on a graphing utility.arrow_forwardThe data in the following table indicate that between the ages of 1 and 11, the human brain does not grow linearly, or steadily. A scatter plot for the data is shown below the table. The graphing calculator screen to the right displays the percentage of an adult brain, y, for a child at age x, where 1 sxs11. Use this information to complete parts (a) through (c) below. LnReg y = a+b ln x a = 29.67892724 b= 29.78535801 E Click the icon to view the table. W Click the icon to view the scatterplot. a. Explain why a logarithmic function was used to model the data. Choose the correct answer below. O A. The data increase rapidly and then continue to increase even more rapidly. B. The data increase at a steady rate. OC. The data increase rapidly and then begin to decrease. D. The data increase rapidly and then begin to level off. b. Use the graphing calculator screen to express the model in function notation, with numbers rounded to the nearest whole number. f(x) = (Type an expression using x…arrow_forwardan you tell how old a lobster is by its size? This question was investigated by the authors of a paper that appeared in the Biological Bulletin (August 2007). Researchers measured carapace (the exterior shell) length of 27 laboratory-raised lobsters of known age. The data on x = carapace length (in mm) and y = age (in years) in the following table were read from a graph that appeared in the paper. Age CarapaceLength Age CarapaceLength Age CarapaceLength 1.00 63.32 1.82 118.25 2.93 147.82 1.00 67.50 2.18 108.24 2.92 140.17 1.00 69.58 2.18 109.64 2.92 135.73 1.00 74.41 2.17 117.99 2.92 121.81 1.42 80.32 2.17 123.81 3.17 141.30 1.42 81.80 2.33 138.47 3.41 151.73 1.42 84.59 2.50 133.95 3.42 145.78 1.82 105.07 2.51 124.25 3.75 147.21 1.82 106.16 2.50 123.51 4.08 152.04 (a) Construct a scatterplot of these data, and then find the equation of the least squares regression line that describes the relationship between y = age and x = carapace length. A scatterplot…arrow_forward
- regression is done on data that represent ordered pairs true or falsearrow_forwardAre rent rates influenced by the student population in a college town? Let rent be the average monthly rent paid on rental units in a college town in the United States. Let pop denote the total city population, avginc the average city income, and pctstu the student population as a percentage of the total popula- tion. One model to test for a relationship is log(rent) = Bo + Bilog(pop) + Bilog(avginc) + Bpctstu + u. (i) State the null hypothesis that size of the student body relative to the population has no ceteris paribus effect on monthly rents. State the alternative that there is an effect. (ii) What signs do you expect for B, and B2? (iii) The equation estimated using 1990 data from RENTAL for 64 college towns is log(rent) = .043 + .066 log(pop) + .507 log(avginc) + .0056 pctstu (.844) (.039) (.081) (.0017) n = 64, R? = .458. What is wrong with the statement: “A 10% increase in population is associated with about a 6.6% increase in rent"? (iv) Test the hypothesis stated in part (i)…arrow_forwardLinear Regression - Christmas Trees The following table gives the total number of live Christmas trees sold, in millions, in the United States from 2004 to 2011. (Source: Statista.com). t = number of years since 2004 C = total number of Christmas trees sold in the U.S. (in millions) 1. Use the TABLE to determine the number of live Christmas trees sold in the year 2008. In 2008, there were approximately с 0 = 27.1 2 28.6 4 28.2 6 27 7 30.8 2. Determine the linear regression equation that models the set of data above. Use the indicated variables and proper function notation. Round to the nearest hundredth as needed. million live Christmas trees sold in the U.S. 3. Interpret the meaning of the slope of your (rounded) regression model. From 2004 to 2011, the number of Christmas trees sold in the U.S. increased by approximately million trees each year. 4. Use the REGRESSION EQUATION to determine the number of live Christmas trees sold in the year 2008. In 2008, there were approximately 5.…arrow_forward
- Define the different ways to use linear regression?arrow_forwardWrite the equation in the slope intercept form for the linear functionarrow_forwardWe use two data points and an exponential function to model the population of the United States from 1970 through 2010. The data are shown in the table. Use all five data points to solve, Use your graphing utility’s linear regression option to obtain a model of the form y = ax + b that fits the data. How well does the correlation coefficient, r, indicate that the model fitsthe data?arrow_forward

 Glencoe Algebra 1, Student Edition, 9780079039897...AlgebraISBN:9780079039897Author:CarterPublisher:McGraw Hill
 Big Ideas Math A Bridge To Success Algebra 1: Stu...AlgebraISBN:9781680331141Author:HOUGHTON MIFFLIN HARCOURTPublisher:Houghton Mifflin Harcourt
 Algebra & Trigonometry with Analytic GeometryAlgebraISBN:9781133382119Author:SwokowskiPublisher:Cengage