Concept explainers
Videos
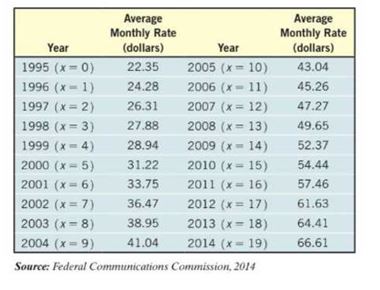
Cable Rates The data on the right represent the average monthly rate charged for expanded basic cable television in the United States from 1995 to 2014. A market researcher believes that external factors, such as the growth of satellite television and internet programming, have affected the cost of basic cable. She is interested in building a model that will describe the average monthly cost of basic cable.
(a) Using a graphing utility, draw a
(b) Using a graphing utility, build a logistic model from the data.
(c) Graph the logistic function found in part (b) on the scatter diagram.
(d) Based on the model found in part (b), what is the maximum possible average monthly rate for basic cable?
(e) Use the model to predict the average rate for basic cable in 2018.
Want to see the full answer?
Check out a sample textbook solution
Chapter 5 Solutions
Precalculus Enhanced with Graphing Utilities, Books a la Carte Edition Plus NEW MyLab Math -- Access Card Package (7th Edition)


- Which degenerate conic is formed when a double cone is sliced through the apex by a plane parallel to the slant edge of the cone?arrow_forward1/ Solve the following: 1 x + X + cos(3X) -75 -1 2 2 (5+1) e 5² + 5 + 1 3 L -1 1 5² (5²+1) 1 5(5-5)arrow_forwardI need expert handwritten solution.to this integralarrow_forward
- Example: If ƒ (x + 2π) = ƒ (x), find the Fourier expansion f(x) = eax in the interval [−π,π]arrow_forwardExample: If ƒ (x + 2π) = ƒ (x), find the Fourier expansion f(x) = eax in the interval [−π,π]arrow_forwardPlease can you give detailed steps on how the solutions change from complex form to real form. Thanks.arrow_forward
- Examples: Solve the following differential equation using Laplace transform (e) ty"-ty+y=0 with y(0) = 0, and y'(0) = 1arrow_forwardExamples: Solve the following differential equation using Laplace transform (a) y" +2y+y=t with y(0) = 0, and y'(0) = 1arrow_forwardπ 25. If lies in the interval <0arrow_forwardarrow_back_iosSEE MORE QUESTIONSarrow_forward_ios
 Glencoe Algebra 1, Student Edition, 9780079039897...AlgebraISBN:9780079039897Author:CarterPublisher:McGraw Hill
 Trigonometry (MindTap Course List)TrigonometryISBN:9781305652224Author:Charles P. McKeague, Mark D. TurnerPublisher:Cengage Learning
 Big Ideas Math A Bridge To Success Algebra 1: Stu...AlgebraISBN:9781680331141Author:HOUGHTON MIFFLIN HARCOURTPublisher:Houghton Mifflin Harcourt
 Functions and Change: A Modeling Approach to Coll...AlgebraISBN:9781337111348Author:Bruce Crauder, Benny Evans, Alan NoellPublisher:Cengage Learning
 Holt Mcdougal Larson Pre-algebra: Student Edition...AlgebraISBN:9780547587776Author:HOLT MCDOUGALPublisher:HOLT MCDOUGAL