
Introduction To Statistics And Data Analysis
6th Edition
ISBN: 9781337793612
Author: PECK, Roxy.
Publisher: Cengage Learning,
expand_more
expand_more
format_list_bulleted
Concept explainers
Videos
Textbook Question
Chapter 5.3, Problem 49E
The article “California State Parks Closure List Due Soon” (The Sacramento Bee, August 30, 2009) gave the following data on y = Number of employees in fiscal year 2007-2008 and x = Total size of parks (in acres) for the 20 state park districts in California:
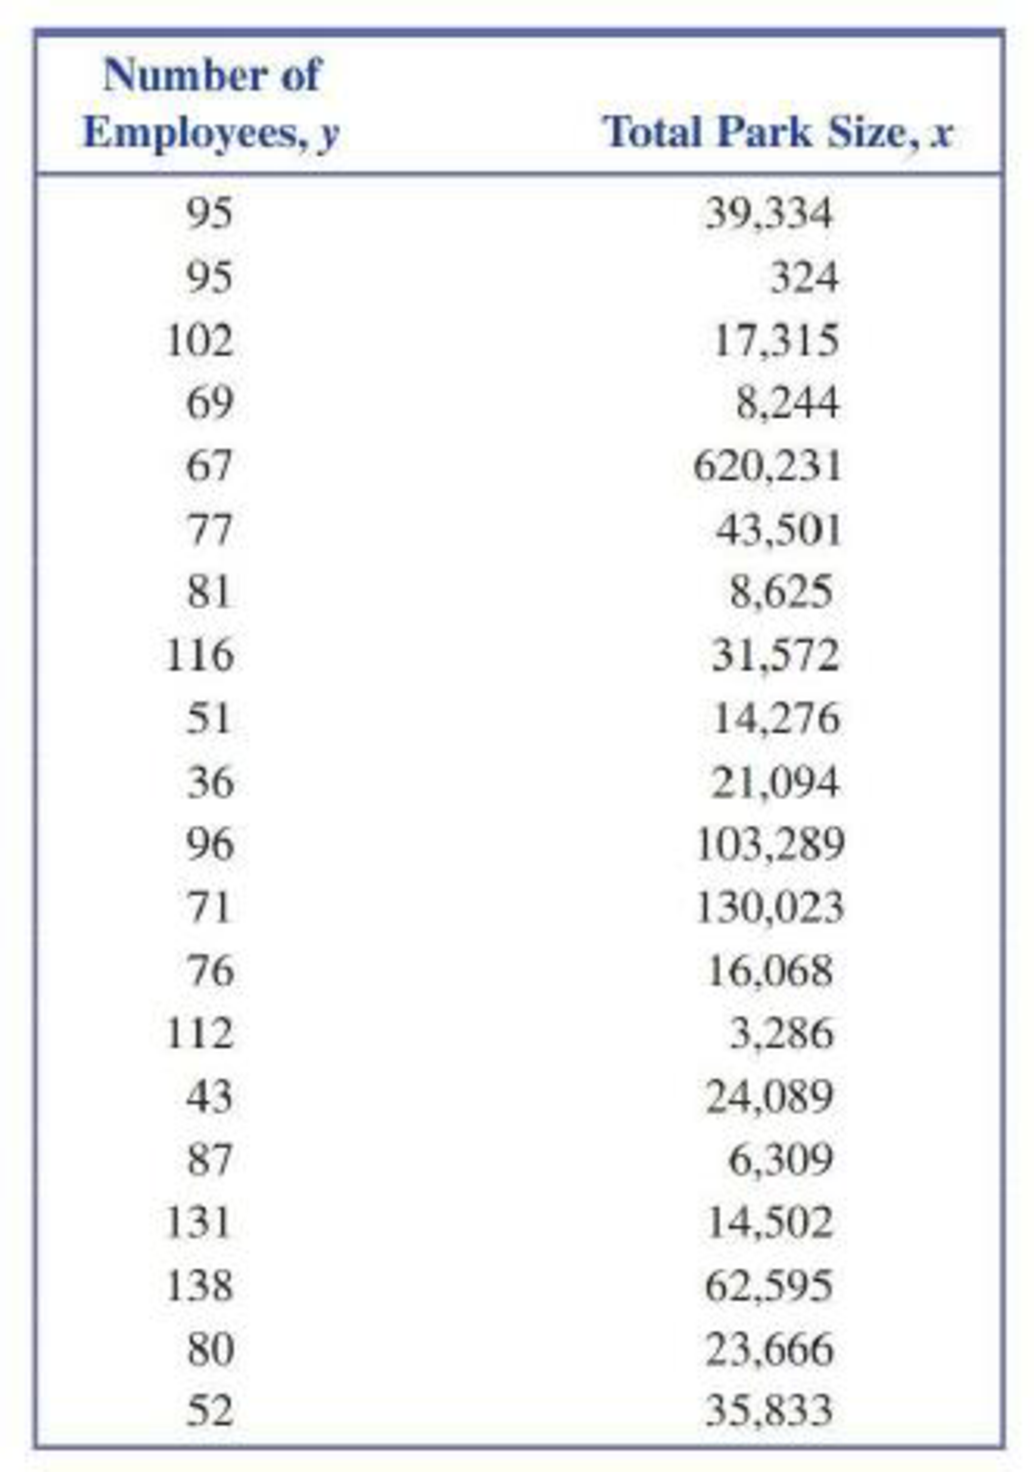
- a. Construct a
scatterplot of the data. - b. Find the equation of the least-squares line.
- c. Do you think the least-squares line gives accurate predictions? Explain.
- d. Delete the observation with the largest x value from the data set and recalculate the equation of the least-squares line. Does this observation greatly affect the equation of the line?
Expert Solution & Answer
Want to see the full answer?
Check out a sample textbook solution
Students have asked these similar questions
Une Entreprise œuvrant dans le domaine du multividéo donne l'opportunité à ses
programmeurs-analystes d'évaluer la performance des cadres supérieurs.
Voici les résultats obtenues (sur une échelle de 10 à 50) où 50 représentent une
excellente performance. 10 programmeurs furent sélectionnés au hazard pour
évaluer deux cadres. Un rapport Excel est également fourni.
Programmeurs
Cadre A Cadre B
1
34
36
2
32
34
3
18
19
33
38
19
21
21
23
7
35
34
8
20
20
9
34
34
10
36
34
Test d'égalité des espérances: observations pairées
A television news channel samples 25 gas stations from its local area and uses the results to estimate the average gas price for the state. What’s wrong with its margin of error?
You’re fed up with keeping Fido locked inside, so you conduct a mail survey to find out people’s opinions on the new dog barking ordinance in a certain city. Of the 10,000 people who receive surveys, 1,000 respond, and only 80 are in favor of it. You calculate the margin of error to be 1.2 percent. Explain why this reported margin of error is misleading.
Chapter 5 Solutions
Introduction To Statistics And Data Analysis
Ch. 5.1 - For each of the scatterplots shown, answer the...Ch. 5.1 - For each of the following pairs of variables,...Ch. 5.1 - For each of the following pairs of variables,...Ch. 5.1 - For each of the following pairs of variables,...Ch. 5.1 - Is the following statement correct? Explain why or...Ch. 5.1 - Draw a scatterplot for which r = 1.Ch. 5.1 - Draw a scatterplot for which r = 1.Ch. 5.1 - Each year J.D. Power and Associates surveys new...Ch. 5.1 - The accompanying data are x = Cost (cents per...Ch. 5.1 - The authors of the paper Flat-footedness Is Not a...
Ch. 5.1 - The paper The Relationship Between Cell Phone Use,...Ch. 5.1 - Data from the U.S. Federal Reserve Board (federal...Ch. 5.1 - The article 115K! The 13 Best Paying U.S....Ch. 5.1 - It may seem odd, but one of the ways biologists...Ch. 5.1 - An auction house released a list of 25 recently...Ch. 5.1 - A sample of automobiles traversing a certain...Ch. 5.2 - Two scatterplots are shown below. Explain why it...Ch. 5.2 - The authors of the paper Statistical Methods for...Ch. 5.2 - The accompanying data are a subset of data from...Ch. 5.2 - The authors of the paper Evaluating Existing...Ch. 5.2 - The authors of the paper referenced in the...Ch. 5.2 - A sample of 548 ethnically diverse students from...Ch. 5.2 - The relationship between hospital patient-to-nurse...Ch. 5.2 - The report Airline Quality Rating 2016...Ch. 5.2 - Acrylamide is a chemical that is sometimes found...Ch. 5.2 - Use the acrylamide data given in the previous...Ch. 5.2 - Studies have shown that people who suffer sudden...Ch. 5.2 - The data given in the previous exercise on x =...Ch. 5.2 - An article on the cost of housing in Califomia...Ch. 5.2 - The following data on sale price, size, and...Ch. 5.2 - Explain why it can be dangerous to use the...Ch. 5.2 - The sales manager of a large company selected a...Ch. 5.2 - Explain why the slope b of the least-squares line...Ch. 5.2 - Prob. 34ECh. 5.3 - Does it pay to stay in school? The report Trends...Ch. 5.3 - The data in the accompanying table is from the...Ch. 5.3 - The paper referenced in the previous exercise also...Ch. 5.3 - Consider the residual plot from the previous...Ch. 5.3 - The report Airline Quality Rating 2016...Ch. 5.3 - Acrylamide is a chemical that is sometimes found...Ch. 5.3 - Consider the scatterplot of acrylamide...Ch. 5.3 - Some types of algae have the potential to cause...Ch. 5.3 - The relationship between x = Total number of...Ch. 5.3 - The residuals from the least-squares line for the...Ch. 5.3 - The first Batman movie was made over 50 years ago...Ch. 5.3 - The article 115K! The 13 Best Paying U.S....Ch. 5.3 - The article Examined Life: What Stanley H. Kaplan...Ch. 5.3 - The accompanying data are a subset of data from...Ch. 5.3 - The article California State Parks Closure List...Ch. 5.3 - The article referenced in the previous exercise...Ch. 5.3 - A study was carried out to investigate the...Ch. 5.3 - Both r2 and se are used to assess the fit of a...Ch. 5.3 - Prob. 53ECh. 5.4 - The following data on x = Frying time (in seconds)...Ch. 5.4 - Use the information provided in the previous...Ch. 5.4 - The paper Aspects of Food Finding by Wintering...Ch. 5.4 - Food intake of grazing animals is limited by the...Ch. 5.4 - A study, described in the paper Prediction of...Ch. 5.4 - Prob. 59ECh. 5.4 - The following table gives the number of heart...Ch. 5.4 - Refer to the heart transplant data given in the...Ch. 5.4 - The paper Population Pressure and Agricultural...Ch. 5.4 - Determining the age of an animal can sometimes be...Ch. 5.5 - The paper How Lead Exposure Relates to Temporal...Ch. 5.5 - The following quote is from the paper Evaluation...Ch. 5 - The accompanying data represent x = Amount of...Ch. 5 - The paper A Cross-National Relationship Between...Ch. 5 - The following data on x = Score on a measure of...Ch. 5 - The paper Effects of Canine Parvovirus (CPV) on...Ch. 5 - The paper Depression, Body Mass Index, and Chronic...Ch. 5 - The paper Aspects of Food Finding by Wintering...Ch. 5 - Data on salmon availability (x) and the percentage...Ch. 5 - No tortilla chip lover likes soggy chips, so it is...Ch. 5 - The article Reduction is Soluble Protein and...Ch. 5 - The following quote is from the paper The Weight...Ch. 5 - An accurate assessment of oxygen consumption...Ch. 5 - Consider the four (x, y) pairs (0, 0), (1, 1), 1,...Ch. 5 - Prob. 1CRECh. 5 - Data from a survey of 1046 adults age 50 and older...Ch. 5 - Prob. 3CRECh. 5 - Prob. 4CRECh. 5 - Prob. 5CRECh. 5 - The amount of money spent each year on science,...Ch. 5 - Below are the data used to construct the time...Ch. 5 - In August 2009, Harris Interactive released the...Ch. 5 - Prob. 9CRECh. 5 - Prob. 10CRECh. 5 - Prob. 11CRECh. 5 - Prob. 12CRECh. 5 - Cost-to-charge ratios (the percentage of the...Ch. 5 - In the article Reproductive Biology of the Aquatic...Ch. 5 - Prob. 15CRECh. 5 - Anabolic steroid abuse has been increasing despite...Ch. 5 - Prob. 81ECh. 5 - Prob. 82ECh. 5 - Prob. 83ECh. 5 - Prob. 84ECh. 5 - Suppose the hypothetical data below are from a...Ch. 5 - Prob. 86E
Additional Math Textbook Solutions
Find more solutions based on key concepts
Find all solutions of each equation in the interval .
Precalculus: A Unit Circle Approach (3rd Edition)
(a) Make a stem-and-leaf plot for these 24 observations on the number of customers who used a down-town CitiBan...
APPLIED STAT.IN BUS.+ECONOMICS
The first derivative of function y=25x4.
Calculus for Business, Economics, Life Sciences, and Social Sciences (14th Edition)
Empirical versus Theoretical A Monopoly player claims that the probability of getting a 4 when rolling a six-si...
Introductory Statistics
Complete each statement with the correct term from the column on the right. Some of the choices may not be used...
Intermediate Algebra (13th Edition)
Knowledge Booster


Learn more about
Need a deep-dive on the concept behind this application? Look no further. Learn more about this topic, statistics and related others by exploring similar questions and additional content below.Similar questions
- You find out that the dietary scale you use each day is off by a factor of 2 ounces (over — at least that’s what you say!). The margin of error for your scale was plus or minus 0.5 ounces before you found this out. What’s the margin of error now?arrow_forwardSuppose that Sue and Bill each make a confidence interval out of the same data set, but Sue wants a confidence level of 80 percent compared to Bill’s 90 percent. How do their margins of error compare?arrow_forwardSuppose that you conduct a study twice, and the second time you use four times as many people as you did the first time. How does the change affect your margin of error? (Assume the other components remain constant.)arrow_forward
- Out of a sample of 200 babysitters, 70 percent are girls, and 30 percent are guys. What’s the margin of error for the percentage of female babysitters? Assume 95 percent confidence.What’s the margin of error for the percentage of male babysitters? Assume 95 percent confidence.arrow_forwardYou sample 100 fish in Pond A at the fish hatchery and find that they average 5.5 inches with a standard deviation of 1 inch. Your sample of 100 fish from Pond B has the same mean, but the standard deviation is 2 inches. How do the margins of error compare? (Assume the confidence levels are the same.)arrow_forwardA survey of 1,000 dental patients produces 450 people who floss their teeth adequately. What’s the margin of error for this result? Assume 90 percent confidence.arrow_forward
- The annual aggregate claim amount of an insurer follows a compound Poisson distribution with parameter 1,000. Individual claim amounts follow a Gamma distribution with shape parameter a = 750 and rate parameter λ = 0.25. 1. Generate 20,000 simulated aggregate claim values for the insurer, using a random number generator seed of 955.Display the first five simulated claim values in your answer script using the R function head(). 2. Plot the empirical density function of the simulated aggregate claim values from Question 1, setting the x-axis range from 2,600,000 to 3,300,000 and the y-axis range from 0 to 0.0000045. 3. Suggest a suitable distribution, including its parameters, that approximates the simulated aggregate claim values from Question 1. 4. Generate 20,000 values from your suggested distribution in Question 3 using a random number generator seed of 955. Use the R function head() to display the first five generated values in your answer script. 5. Plot the empirical density…arrow_forwardFind binomial probability if: x = 8, n = 10, p = 0.7 x= 3, n=5, p = 0.3 x = 4, n=7, p = 0.6 Quality Control: A factory produces light bulbs with a 2% defect rate. If a random sample of 20 bulbs is tested, what is the probability that exactly 2 bulbs are defective? (hint: p=2% or 0.02; x =2, n=20; use the same logic for the following problems) Marketing Campaign: A marketing company sends out 1,000 promotional emails. The probability of any email being opened is 0.15. What is the probability that exactly 150 emails will be opened? (hint: total emails or n=1000, x =150) Customer Satisfaction: A survey shows that 70% of customers are satisfied with a new product. Out of 10 randomly selected customers, what is the probability that at least 8 are satisfied? (hint: One of the keyword in this question is “at least 8”, it is not “exactly 8”, the correct formula for this should be = 1- (binom.dist(7, 10, 0.7, TRUE)). The part in the princess will give you the probability of seven and less than…arrow_forwardplease answer these questionsarrow_forward
- Selon une économiste d’une société financière, les dépenses moyennes pour « meubles et appareils de maison » ont été moins importantes pour les ménages de la région de Montréal, que celles de la région de Québec. Un échantillon aléatoire de 14 ménages pour la région de Montréal et de 16 ménages pour la région Québec est tiré et donne les données suivantes, en ce qui a trait aux dépenses pour ce secteur d’activité économique. On suppose que les données de chaque population sont distribuées selon une loi normale. Nous sommes intéressé à connaitre si les variances des populations sont égales.a) Faites le test d’hypothèse sur deux variances approprié au seuil de signification de 1 %. Inclure les informations suivantes : i. Hypothèse / Identification des populationsii. Valeur(s) critique(s) de Fiii. Règle de décisioniv. Valeur du rapport Fv. Décision et conclusion b) A partir des résultats obtenus en a), est-ce que l’hypothèse d’égalité des variances pour cette…arrow_forwardAccording to an economist from a financial company, the average expenditures on "furniture and household appliances" have been lower for households in the Montreal area than those in the Quebec region. A random sample of 14 households from the Montreal region and 16 households from the Quebec region was taken, providing the following data regarding expenditures in this economic sector. It is assumed that the data from each population are distributed normally. We are interested in knowing if the variances of the populations are equal. a) Perform the appropriate hypothesis test on two variances at a significance level of 1%. Include the following information: i. Hypothesis / Identification of populations ii. Critical F-value(s) iii. Decision rule iv. F-ratio value v. Decision and conclusion b) Based on the results obtained in a), is the hypothesis of equal variances for this socio-economic characteristic measured in these two populations upheld? c) Based on the results obtained in a),…arrow_forwardA major company in the Montreal area, offering a range of engineering services from project preparation to construction execution, and industrial project management, wants to ensure that the individuals who are responsible for project cost estimation and bid preparation demonstrate a certain uniformity in their estimates. The head of civil engineering and municipal services decided to structure an experimental plan to detect if there could be significant differences in project evaluation. Seven projects were selected, each of which had to be evaluated by each of the two estimators, with the order of the projects submitted being random. The obtained estimates are presented in the table below. a) Complete the table above by calculating: i. The differences (A-B) ii. The sum of the differences iii. The mean of the differences iv. The standard deviation of the differences b) What is the value of the t-statistic? c) What is the critical t-value for this test at a significance level of 1%?…arrow_forward
arrow_back_ios
SEE MORE QUESTIONS
arrow_forward_ios
Recommended textbooks for you
 Glencoe Algebra 1, Student Edition, 9780079039897...AlgebraISBN:9780079039897Author:CarterPublisher:McGraw Hill
 Holt Mcdougal Larson Pre-algebra: Student Edition...AlgebraISBN:9780547587776Author:HOLT MCDOUGALPublisher:HOLT MCDOUGAL
 Big Ideas Math A Bridge To Success Algebra 1: Stu...AlgebraISBN:9781680331141Author:HOUGHTON MIFFLIN HARCOURTPublisher:Houghton Mifflin Harcourt
 Functions and Change: A Modeling Approach to Coll...AlgebraISBN:9781337111348Author:Bruce Crauder, Benny Evans, Alan NoellPublisher:Cengage Learning
 Linear Algebra: A Modern IntroductionAlgebraISBN:9781285463247Author:David PoolePublisher:Cengage Learning
Glencoe Algebra 1, Student Edition, 9780079039897...
Algebra
ISBN:9780079039897
Author:Carter
Publisher:McGraw Hill
Holt Mcdougal Larson Pre-algebra: Student Edition...
Algebra
ISBN:9780547587776
Author:HOLT MCDOUGAL
Publisher:HOLT MCDOUGAL
Big Ideas Math A Bridge To Success Algebra 1: Stu...
Algebra
ISBN:9781680331141
Author:HOUGHTON MIFFLIN HARCOURT
Publisher:Houghton Mifflin Harcourt
Functions and Change: A Modeling Approach to Coll...
Algebra
ISBN:9781337111348
Author:Bruce Crauder, Benny Evans, Alan Noell
Publisher:Cengage Learning
Linear Algebra: A Modern Introduction
Algebra
ISBN:9781285463247
Author:David Poole
Publisher:Cengage Learning
Statistics 4.1 Point Estimators; Author: Dr. Jack L. Jackson II;https://www.youtube.com/watch?v=2MrI0J8XCEE;License: Standard YouTube License, CC-BY
Statistics 101: Point Estimators; Author: Brandon Foltz;https://www.youtube.com/watch?v=4v41z3HwLaM;License: Standard YouTube License, CC-BY
Central limit theorem; Author: 365 Data Science;https://www.youtube.com/watch?v=b5xQmk9veZ4;License: Standard YouTube License, CC-BY
Point Estimate Definition & Example; Author: Prof. Essa;https://www.youtube.com/watch?v=OTVwtvQmSn0;License: Standard Youtube License
Point Estimation; Author: Vamsidhar Ambatipudi;https://www.youtube.com/watch?v=flqhlM2bZWc;License: Standard Youtube License