Concept explainers
Methods of Cost Analysis: Account Analysis, Simple and Multiple Regression Using a Spreadsheet (Appendix A)
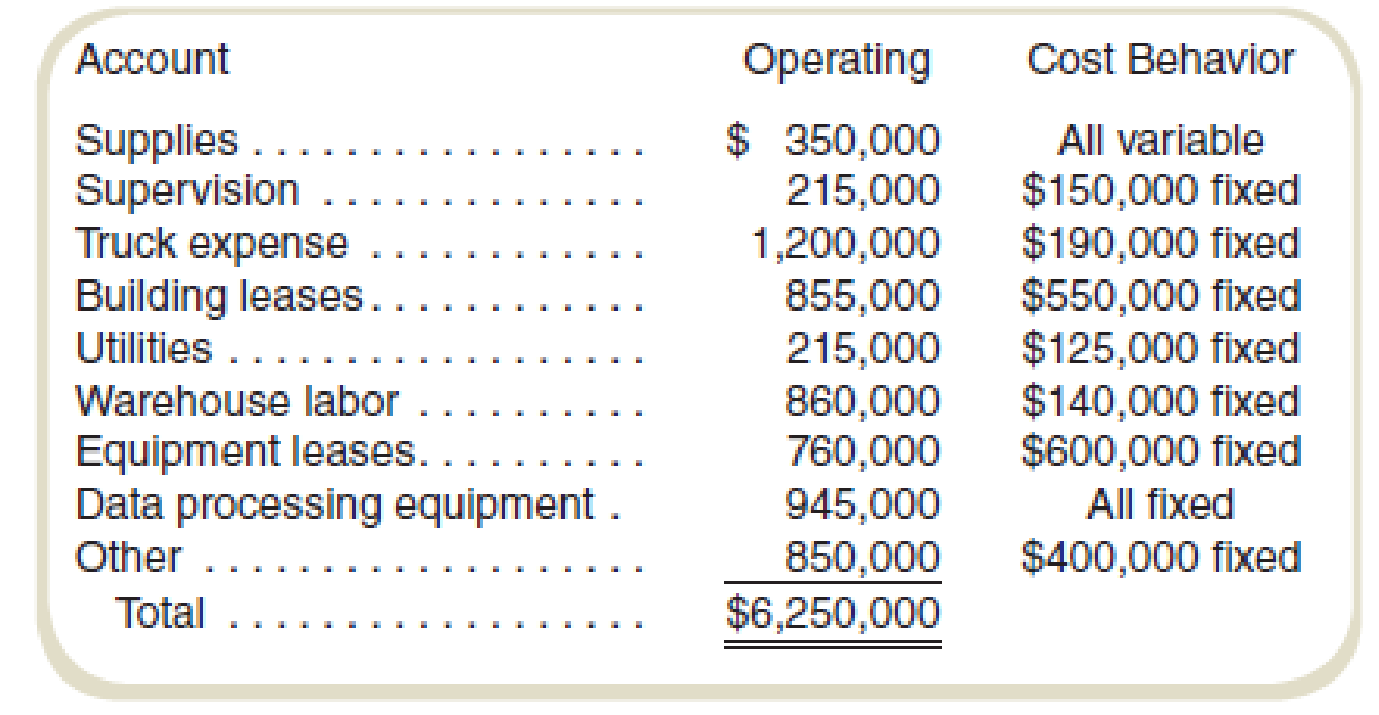
Caiman Distribution Partners is the Brazilian distribution company of a U.S. consumer products firm. Inflation in Brazil has made bidding and budgeting difficult for marketing managers trying to penetrate some of the country’s rural regions. The company expects to distribute 450,000 cases of products in Brazil next month. The controller has classified operating costs (excluding costs of the distributed product) as follows:

Although
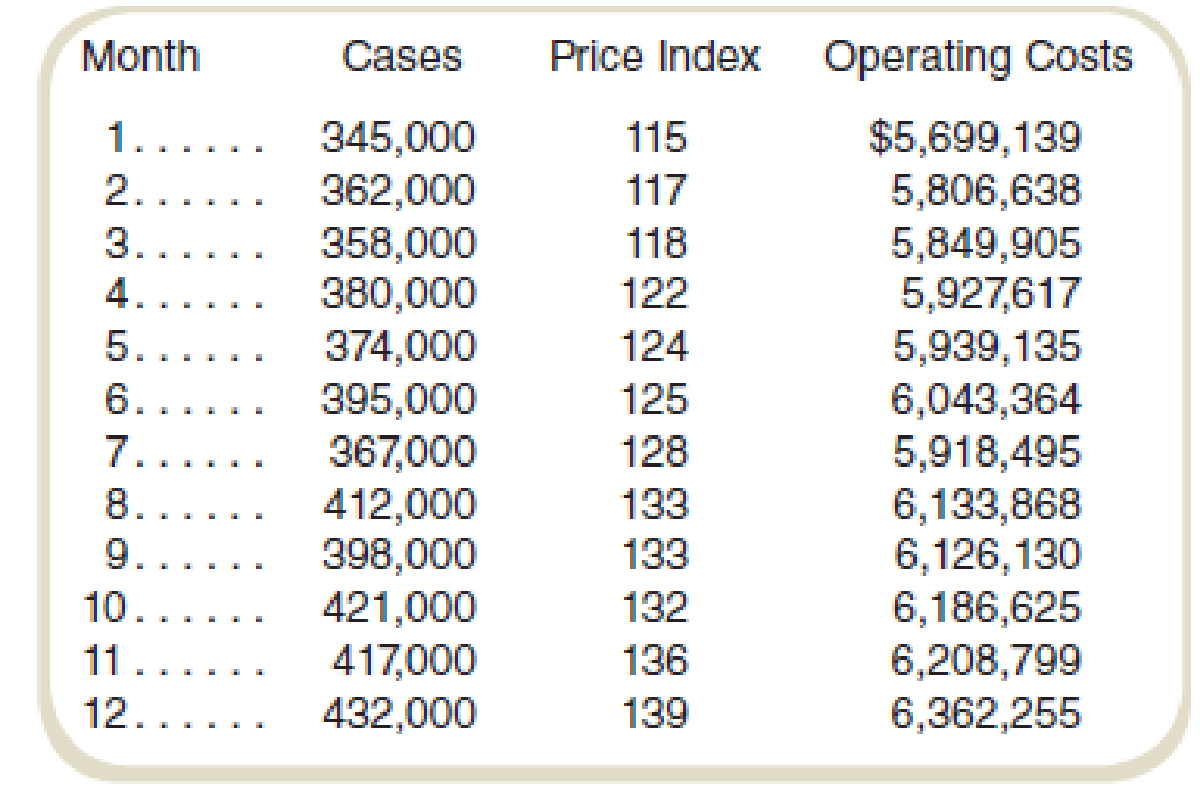
Following instructions from the corporate offices, the controller’s office in Brazil collected the following information for monthly operations from last year:

These data are considered representative for both past and future operations in Brazil.
Required
- a. Prepare an estimate of operating costs assuming that 450,000 cases will be shipped next month based on the controller’s analysis of accounts.
- b. Use the high-low method to prepare an estimate of operating costs assuming that 450,000 cases will be shipped next month.
- c. Prepare an estimate of operating costs assuming that 450,000 cases will be shipped next month by using the results of a simple regression of operating costs on cases shipped.
- d. Prepare an estimate of operating costs assuming that 450,000 cases will be shipped next month by using the results of a multiple regression of operating costs on cases shipped and the price level. Assume a price level of 145 for next month.
- e. Make a recommendation to the managers about the most appropriate estimate given the circumstances.
a.
Prepare an estimate of operating costs assuming that 450,000 cases will be shipped next month based on the controller’s analysis of accounts.
Explanation of Solution
Operating cost:
Operating cost is the total cost of the production. It includes direct and indirect cost of the production. Operating profit is calculated by deducting the operating cost from the revenue of the business.
Calculate the estimated overhead cost:
Thus, the estimated overhead cost is $6,250,000.
Working note 1:
Calculate the variable cost per unit:
Working note 2:
Prepare a schedule to show the allocation of fixed and variable cost:
| Particulars |
Operating cost (a) |
Fixed cost (b) |
Variable cost |
| Supplies | $350,000 | $0 | $350,000 |
| Supervision | $215,000 | $150,000 | $65,000 |
| Truck expenses | $1,200,000 | $190,000 | $1,010,000 |
| Building lease | $855,000 | $550,000 | $305,000 |
| Utilities | $215,000 | $125,000 | $90,000 |
| Warehouse labor | $860,000 | $140,000 | $720,000 |
| Equipment lease | $760,000 | $600,000 | $160,000 |
| Data processing equipment | $945,000 | $945,000 | $0 |
| Other | $850,000 | $400,000 | $450,000 |
| Total cost | $6,250,000 | $3,100,000 | $3,150,000 |
Table: (1)
b.
Use the high-low method to prepare an estimate of operating costs assuming that 450,000 cases will be shipped next month.
Explanation of Solution
High-low cost method:
High-low cost method helps in separating the fixed and variable cost from the total cost. It is calculated by comparing the highest and lowest level of activities and the cost of these activities.
Show the cost equation of fixed and variable cost with the overhead cost:
Thus, the cost equation is
Working note 1:
Calculate the fixed cost:
Calculate the highest and lowest activity:
| Particular | Cases | Cost |
| Highest activity | 432,000 | $6,362,255 |
| Lowest activity | 345,000 | $5,699,139 |
Table: (2)
Working note 2:
Calculate the variable cost (unit) with the help of high-low cost method:
Working note 3:
Calculate the variable cost ($) with the help of high-low cost method:
c.
Prepare an estimate of operating costs assuming that 450,000 cases will be shipped next month by using the results of a simple regression of operating costs on cases shipped.
Explanation of Solution
Regression analysis:
Regression analysis is used to show the relationship between the cost and the activity. It is used to estimate the cost at various level of activity.
The most important step in the calculation of regression analysis is to establish a logical relationship between the cost and the activity. The activity (independent variable) is placed on the right-hand side and the cost (dependent variable) is placed on the left-hand side of the graph.
Calculate the regression analysis to compute the cost equation:
| Regression Statistics | ||||||||
| Multiple R | 0.980345 | |||||||
| R Square | 0.961076 | |||||||
| Adjusted R Square | 0.957184 | |||||||
| Standard Error | 39850.14 | |||||||
| Observations | 12 | |||||||
| ANOVA | ||||||||
| Df | SS | MS | F | Significance F | ||||
| Regression | 1 | 3.92E+11 | 3.92E+11 | 246.9132 | 2.24E-08 | |||
| Residual | 10 | 1.59E+10 | 1.59E+09 | |||||
| Total | 11 | 4.08E+11 | ||||||
| Coefficients | Standard Error | t Stat | P-value | Lower 95% | Upper 95% | Lower 95.0% | Upper 95.0% | |
| Intercept | 3411468 | 166203 | 20.52591 | 1.66E-09 | 3041145 | 3781791 | 3041145 | 3781791 |
| X Variable 1 | 6.707649 | 0.426873 | 15.71347 | 2.24E-08 | 5.756518 | 7.658781 | 5.756518 | 7.658781 |
Table: (3)
The regression analysis of the company provides the following details:
Calculate the cost equation:
Put the values in the cost equation:
Thus, the operating cost equation is:
d.
Prepare an estimate of operating costs assuming that 450,000 cases will be shipped next month by using the results of multiple regression of operating costs on cases shipped and the price level.
Explanation of Solution
Regression analysis:
Regression analysis is used to show the relationship between the cost and the activity. It is used to estimate the cost at various level of activity.
The most important step in the calculation of regression analysis is to establish a logical relationship between the cost and the activity. The activity (independent variable) is placed on the right-hand side, and the cost (dependent variable) is placed on the left-hand side of the graph.
| SUMMARY OUTPUT | ||||||||
| Regression Statistics | ||||||||
| Multiple R | 0.990475 | |||||||
| R Square | 0.981042 | |||||||
| Adjusted R Square | 0.976829 | |||||||
| Standard Error | 29315.83 | |||||||
| Observations | 12 | |||||||
| ANOVA | ||||||||
| df | SS | MS | F | Significance F | ||||
| Regression | 2 | 4E+11 | 2E+11 | 232.8623 | 1.78E-08 | |||
| Residual | 9 | 7.73E+09 | 8.59E+08 | |||||
| Total | 11 | 4.08E+11 | ||||||
| Coefficients | Standard Error | t Stat | P-value | Lower 95% | Upper 95% | Lower 95.0% | Upper 95.0% | |
| Intercept | 3176995 | 144048.2 | 22.05509 | 3.83E-09 | 2851136 | 3502855 | 2851136 | 3502855 |
| X Variable 1 | 8857.728 | 2877.157 | 3.078639 | 0.013169 | 2349.147 | 15366.31 | 2349.147 | 15366.31 |
| X Variable 2 | 4.418915 | 0.807028 | 5.475543 | 0.000392 | 2.593292 | 6.244539 | 2.593292 | 6.244539 |
Table: (4)
The regression analysis of the company provides the following details:
Calculate the cost equation:
Put the values in the cost equation:
Thus, the operating cost equation is
e.
Make a recommendation to the managers about the most appropriate estimate given the circumstances.
Explanation of Solution
Recommendation to the manager:
The multiple regressions seem to be more useful as per the adjusted R2. But the inclusion of price index may not be dependent on the cost of the product instead on the growth of the business. So correlating the price with the cost will not be very useful.
Simple regression is easy to compute, and it shows the clear relationship between the cost and the revenue so it should be considered for the cost estimation.
Thus, management should consider the simple regression for the cost estimation.
Want to see more full solutions like this?
Chapter 5 Solutions
Fundamentals of Cost Accounting
 Managerial AccountingAccountingISBN:9781337912020Author:Carl Warren, Ph.d. Cma William B. TaylerPublisher:South-Western College Pub
 Financial And Managerial AccountingAccountingISBN:9781337902663Author:WARREN, Carl S.Publisher:Cengage Learning,
 Managerial Accounting: The Cornerstone of Busines...AccountingISBN:9781337115773Author:Maryanne M. Mowen, Don R. Hansen, Dan L. HeitgerPublisher:Cengage Learning


