Fundamentals of Cost Accounting
6th Edition
ISBN: 9781260708783
Author: LANEN, William
Publisher: MCGRAW-HILL HIGHER EDUCATION
expand_more
expand_more
format_list_bulleted
Textbook Question
Chapter 5, Problem 64P
Interpretation of Regression Results
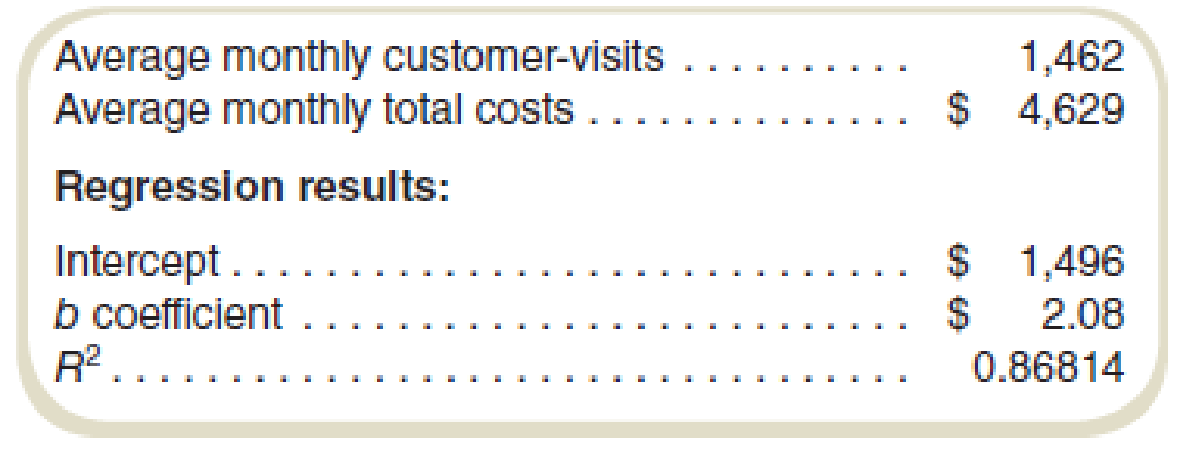
Brews 4 U is a local chain of coffee shops. Managers are interested in the costs of the stores and believe that the costs can be explained in large part by the number of customers patronizing the stores. Monthly data regarding customer visits and costs for the preceding year for one of the stores have been entered into the regression analysis.
Required
- a. In a regression equation expressed as y = a + bx, how is the letter b best described?
- b. How is the letter y in the regression equation best described?
- c. How is the letter x in the regression equation best described?
- d. Based on the data derived from the regression analysis, what are the estimated costs for 1,600 customer-visits in a month?
- e. What is the percent of the total variance that can be explained by the regression equation?
Expert Solution & Answer
Want to see the full answer?
Check out a sample textbook solutionStudents have asked these similar questions
Assume you have asked your data folks to determine the relationship between customer service scores (i.e. the ratings provided by customers in response to a survey) and profit. The analyst reports the following:
"I gathered data for the last 48 months and ran a regression where profit in a given month is the dependent variable and customer service score in that same month is the independent variable. I found an intercept of $10,000 (p-value: 0.31) and the coefficient on customer service score is $1,200 (p-value: 0.22). The R-2 (which is appropriate when there is just one independent variable) is 0.07."
What do you infer from the results (two to three sentences, sticking to the information provided) and why?
A manager uses regression to express sales as a function of advertising expenditures (X1), and per capita income (X2) in your sales area. The following multiple linear regression equation is developed:
Y = 10 + 0.51X1 + 0.45X2
The coefficient of determination is 0.96
Determine which of the following conclusions is valid regarding the coefficient of determination:
Multiple Choice
The coefficient of determination should always be greater than one.
More analysis is needed. The coefficient of determination leaves much unexplained.
The coefficient of determination is positive because the constant term is positive.
The regression line fits the data used in the sample very well. There is a strong indication of the relationship of the two variables with sales.
1
Chapter 5 Solutions
Fundamentals of Cost Accounting
Ch. 5 - What are the common methods of cost estimation?Ch. 5 - Prob. 2RQCh. 5 - Under what conditions is the engineering estimates...Ch. 5 - If one wishes simply to prepare a cost estimate...Ch. 5 - When using cost estimation methods based on past...Ch. 5 - Prob. 6RQCh. 5 - What is the difference between R2 and adjusted R2?Ch. 5 - Why are accurate cost estimates important?Ch. 5 - What are three practical implementation problems...Ch. 5 - Why is it important to incorporate learning into...
Ch. 5 - What are some complications that can arise when...Ch. 5 - The following costs are labeled fixed or variable...Ch. 5 - Prob. 13CADQCh. 5 - When preparing cost estimates for account analysis...Ch. 5 - How can one compensate for the effects of price...Ch. 5 - Prob. 16CADQCh. 5 - Prob. 17CADQCh. 5 - A decision maker is interested in obtaining a cost...Ch. 5 - Consider the Business Application item Using...Ch. 5 - A friend comes to you with the following problem....Ch. 5 - After doing an account analysis and giving the...Ch. 5 - In doing cost analysis, you realize that there...Ch. 5 - Prob. 23CADQCh. 5 - Are learning curves likely to affect materials...Ch. 5 - McDonalds, the fast-food restaurant, is known for...Ch. 5 - Prob. 26CADQCh. 5 - A manager asks you for a cost estimate to open a...Ch. 5 - Prob. 28CADQCh. 5 - Methods of Estimating Costs: Engineering Estimates...Ch. 5 - Prob. 30ECh. 5 - Methods of Estimating Costs: Engineering Estimates...Ch. 5 - Prob. 32ECh. 5 - Methods of Estimating Costs: Account Analysis The...Ch. 5 - Methods of Estimating Costs: Account Analysis...Ch. 5 - Methods of Estimating Costs: High-Low, Ethical...Ch. 5 - Methods of Estimating Costs: High-Low Adriana...Ch. 5 - Methods of Estimating Costs: High-Low
Adriana...Ch. 5 - Prob. 38ECh. 5 - Adriana Corporation manufactures football...Ch. 5 - Methods of Estimating Costs: Simple...Ch. 5 - Prob. 41ECh. 5 - Methods of Estimating Costs: High-Low Davis Stores...Ch. 5 - Methods of Estimating Costs: Scattergraph Prepare...Ch. 5 - Prob. 44ECh. 5 - Interpretation of Regression Results: Multiple...Ch. 5 - Interpretation of Regression Results Brodie...Ch. 5 - Prob. 47ECh. 5 - Interpretation of Regression Results: Simple...Ch. 5 - Learning Curves Assume that General Dynamics,...Ch. 5 - Learning Curves Assume that Whee, Cheatham, and...Ch. 5 - Prob. 51ECh. 5 - Learning Curves (Appendix B) Refer to the example...Ch. 5 - Prob. 53PCh. 5 - Prob. 54PCh. 5 - Regressions from Published Data Obtain 13 years of...Ch. 5 - Prob. 56PCh. 5 - High-Low Method, Scattcrgraph Cubicle Solutions...Ch. 5 - High-Low Method, Scattcrgraph Academy Products...Ch. 5 - High-Low, Scattergraph, Issues with Data
Wyoming...Ch. 5 - Interpretation of Regression Results: Simple...Ch. 5 - Interpretation of Regression Results: Simple...Ch. 5 - Interpretation of Regression Results: Multiple...Ch. 5 - Interpretation of Regression Results: Simple...Ch. 5 - Interpretation of Regression Results Brews 4 U is...Ch. 5 - Cost Estimation: Simple Regression The following...Ch. 5 - Prob. 68PCh. 5 - Methods of Cost Analysis: Account Analysis, Simple...Ch. 5 - Learning Curves (Appendix B) Refer to the example...Ch. 5 - Learning Curves (Appendix B) Krylon Company...
Knowledge Booster
Learn more about
Need a deep-dive on the concept behind this application? Look no further. Learn more about this topic, accounting and related others by exploring similar questions and additional content below.Similar questions
- Consider again the example introduced in Section 7.5 of a credit card company that has a database of information provided by its customers when they apply for credit cards. An analyst has created a multiple regression model for which the dependent variable in the model is credit card charges accrued by a customer in the data set over the past year (y), and the independent variables are the customers annual household income (x1), number of members of the household (x2), and number of years of post-high school education (x3). Figure 7.23 provides Excel output for a multiple regression model estimated using a data set the company created. a. Estimate the corresponding simple linear regression with the customers annual household income as the independent variable and credit card charges accrued by a customer over the past year as the dependent variable. Interpret the estimated relationship between the customers annual household income and credit card charges accrued over the past year. How much variation in credit card charges accrued by a customer over the past year is explained by this simple linear regression model? b. Estimate the corresponding simple linear regression with the number of members in the customers household as the independent variable and credit card charges accrued by a customer over the past year as the dependent variable. Interpret the estimated relationship between the number of members in the customers household and credit card charges accrued over the past year. How much variation in credit card charges accrued by a customer over the past year is explained by this simple linear regression model? c. Estimate the corresponding simple linear regression with the customers number of years of posthigh school education as the independent variable and credit card charges accrued by a customer over the past year as the dependent variable. Interpret the estimated relationship between the customers number of years of posthigh school education and credit card charges accrued over the past year. How much variation in credit card charges accrued by a customer over the past year is explained by this simple linear regression model? d. Recall the multiple regression in Figure 7.23 with credit card charges accrued by a customer over the past year as the dependent variable and customers annual household income (x1), number of members of the household (x2), and number of years of post-high school education (x3) as the independent variables. Do the estimated slopes differ substantially from the corresponding slopes that were estimated using simple linear regression in parts (a), (b), and (c)? What does this tell you about multicollinearity in the multiple regression model in Figure 7.23? e. Add the coefficients of determination for the simple linear regression in parts (a), (b), and (c), and compare the result to the coefficient of determination for the multiple regression model in Figure 7.23. What does this tell you about multicollinearity in the multiple regression model in Figure 7.23? f. Add age, a dummy variable for sex, and a dummy variable for whether a customer has exceeded his or her credit limit in the past 12 months as independent variables to the multiple regression model in Figure 7.23. Code the dummy variable for sex as 1 if the customer is female and 0 if male, and code the dummy variable for whether a customer has exceeded his or her credit limit in the past 12 months as 1 if the customer has exceeded his or her credit limit in the past 12 months and 0 otherwise. Do these variables substantially improve the fit of your model?arrow_forwardDixie Showtime Movie Theaters, Inc., owns and operates a chain of cinemas in several markets in the southern United States. The owners would like to estimate weekly gross revenue as a function of advertising expenditures. Data for a sample of eight markets for a recent week follow: a. Develop an estimated regression equation with the amount of television advertising as the independent variable. Test for a significant relationship between television advertising and weekly gross revenue at the 0.05 level of significance. What is the interpretation of this relationship? b. How much of the variation in the sample values of weekly gross revenue does the model in part (a) explain? c. Develop an estimated regression equation with both television advertising and newspaper advertising as the independent variables. Test whether each of the regression parameters 0, 1, and 2 is equal to zero at a 0.05 level of significance. What are the correct interpretations of the estimated regression parameters? Are these interpretations reasonable? d. How much of the variation in the sample values of weekly gross revenue does the model in part (c) explain? e. Given the results in parts (a) and (c), what should your next step be? Explain. f. What are the managerial implications of these results?arrow_forwardA production company manager identify three items namely Item A, Item B and Item C are major contributors to the profit of the company. He found the p-values of each of the item from the multiple regression ANOVA table as follows. Item A 0.035 Item B 0.0305 Item C 0.03005 The most significant contributor item of the company profit? Select one: O a. All Item Ob. Item B O c. Item C Od. Non of the item Oe. Item Aarrow_forward
- Curry Rubber manufactures rubber bands for retail companies. The accounting manager has performed a regression analysis of past data. You notice that the formula has an R-squared of 0.68, a t-value of 2.2, and a standard error of the estimate of $218,200. The estimate for next quarter costs is $2,597,623. Calculate Standard Error as a % of predicted total cost which represents a measure of precision of his regression analysis? (Round your answer to one decimal place, i.e., 0.052 = 5.2%.)arrow_forwardUse the following information to answer the questions that follow. A. Calculate the operating income percentage for each of the stores. Comment on how your analysis has changed for each store. B. Perform a vertical analysis for each store. Based on your analysis, what accounts would you want to investigate further? How might management utilize this information? C. Which method of analysis (using a dollar value or percentage) is most relevant and/or useful? Explain.arrow_forwardJensen Tire Auto is deciding whether to purchase a maintenance contract for its new computer wheel alignment and balancing machine. Managers feel that maintenance expense should be related to usage, and they collected the following information on weekly usage (hours) and annual maintenance expense (in hundreds of dollars). a. Develop a scatter chart with weekly usage hours as the independent variable. What does the scatter chart indicate about the relationship between weekly usage and annual maintenance expense? b. Use the data to develop an estimated regression equation that could be used to predict the annual maintenance expense for a given number of hours of weekly usage. What is the estimated regression model? c. Test whether each of the regression parameters 0 and 1 is equal to zero at a 0.05 level of significance. What are the correct interpretations of the estimated regression parameters? Are these interpretations reasonable? d. How much of the variation in the sample values of annual maintenance expense does the model you estimated in part (b) explain? e. If the maintenance contract costs 3,000 per year, would you recommend purchasing it? Why or why not?arrow_forward
- The Paymore Rental Car Agency rents cars in a small town. It wants to determine how many rental cars it should maintain. Based on market projections and historical data, the manager has determined probability distributions for the number of rentals per day and rental duration (in days only) as shown in the following tables: Number of customers per day Probability 0 .20 1 .20 2 .50 3 .10 Rental duration in days Probability 1 .10 2 .30 3 .40 4 .10 5 .10 Design a simulation experiment for the car agency and simulate using a fleet of four rental cars for 10 days. Compute the probability that the agency will not have a car available upon demand. Should the agency expand its fleet? Explain how a simulation experiment could be designed to determine the optimal fleet size for the Paymore Agency. Use the following random numbers in order (from left to right) for the simulation of number of customers per day: 0.62 0.48 0.96 0.86 0.86 0.29 0.79 0.22 0.08 0.62…arrow_forwardPlease tell me what type of the analysis is if the analysis wants to know which customer purchased over $5000 last year but bought nothing this year. Descriptive analytics. B. Diagnostic analytics. Predictive analytics. D. Prescriptive analyticsarrow_forwardThe controller for Dohini Manufacturing Company felt that the number of purchase orders alone did not explain the monthly purchasing cost. He knew that nonstandard orders (for example, one requiring an overseas supplier) took more time and effort. He collected data on the number of nonstandard orders for the past 12 months and added that information to the data on purchasing cost and total number of purchase orders. Multiple regression was run on the above data; the coefficients shown by the regression program are: Required: 1. Construct the cost formula for the purchasing activity showing the fixed cost and the variable rate. 2. If Dohini Manufacturing Company estimates that next month will have 430 total purchase orders and 45 nonstandard orders, what is the total estimated purchasing cost for that month? (Round your answer to the nearest dollar.) 3. What if Dohini Manufacturing wants to estimate purchasing cost for the coming year and expects 5,340 purchase orders and 580 nonstandard orders? What will estimated total purchasing cost be? What is the total fixed purchasing cost? Why doesnt it equal the fixed cost calculated in Requirement 2? (Round your answers to the nearest dollar.)arrow_forward
- The following time series shows the sales of a particular product over the past 12 months. Construct a time series plot. What type of pattern exists in the data? Use α = 0.3 to compute the exponential smoothing values for the time series. Use trial and error to find a value of the exponential smoothing coefficient α that results in a relatively small MSE.arrow_forwardSouth Shore Construction builds permanent docks and seawalls along the southern shore of Long Island, New York. Although the firm has been in business only five years, revenue has increased from $308,000 in the first year of operation to $1,084,000 in the most recent year. The following data show the quarterly sales revenue in thousands of dollars: Construct a time series plot. What type of pattern exists in the data? Use a multiple regression model with dummy variables as follows to develop an equation to account for seasonal effects in the data: Qtr1 = 1 if quarter I, 0 otherwise; Qtr2 = 1 if quarter 2, 0 otherwise; Qtr3 = 1 if quarter 3, 0 otherwise. Based on the model you developed in part (b), compute estimates of quarterly sales for year 6. Let Period = 1 refer to the observation in quarter 1 of year 1; Period = 2 refer to the observation in quarter 2 of year 1; … and Period = 20 refer to the observation in quarter 4 of year 5. Using the dummy variables defined in part (b) and the variable Period, develop an equation to account for seasonal effects and any linear trend in the time series. Based on the seasonal effects in the data and linear trend estimated in part (c), compute estimates of quarterly sales for year 6. Is the model you developed in part (b) or the model you developed in part (d) more effective? Justify your answer.arrow_forwardRequired: For each business analytics task, identify the correct step in the SOAR analytics model. Business Analytics Task STAN Deciding which data to use in the analysis Running a statistical analysis to evaluate the impact of advertising on sales of targeted products Extracting data from blogs to analyze consumer sentiment regarding Verizon wireless service Communicating current customers' key characteristics to management Analyzing how profits will change if taxes on Chinese-sourced products increase in the coming year Asking which vendor is most reliable based on past performance SOAR Analytics Model Componentarrow_forward
arrow_back_ios
SEE MORE QUESTIONS
arrow_forward_ios
Recommended textbooks for you
- Essentials of Business Analytics (MindTap Course ...StatisticsISBN:9781305627734Author:Jeffrey D. Camm, James J. Cochran, Michael J. Fry, Jeffrey W. Ohlmann, David R. AndersonPublisher:Cengage LearningCornerstones of Cost Management (Cornerstones Ser...AccountingISBN:9781305970663Author:Don R. Hansen, Maryanne M. MowenPublisher:Cengage LearningPrinciples of Accounting Volume 2AccountingISBN:9781947172609Author:OpenStaxPublisher:OpenStax College
- Century 21 Accounting Multicolumn JournalAccountingISBN:9781337679503Author:GilbertsonPublisher:CengageManagerial AccountingAccountingISBN:9781337912020Author:Carl Warren, Ph.d. Cma William B. TaylerPublisher:South-Western College PubFinancial And Managerial AccountingAccountingISBN:9781337902663Author:WARREN, Carl S.Publisher:Cengage Learning,
Essentials of Business Analytics (MindTap Course ...
Statistics
ISBN:9781305627734
Author:Jeffrey D. Camm, James J. Cochran, Michael J. Fry, Jeffrey W. Ohlmann, David R. Anderson
Publisher:Cengage Learning
Cornerstones of Cost Management (Cornerstones Ser...
Accounting
ISBN:9781305970663
Author:Don R. Hansen, Maryanne M. Mowen
Publisher:Cengage Learning
Principles of Accounting Volume 2
Accounting
ISBN:9781947172609
Author:OpenStax
Publisher:OpenStax College
Century 21 Accounting Multicolumn Journal
Accounting
ISBN:9781337679503
Author:Gilbertson
Publisher:Cengage
Managerial Accounting
Accounting
ISBN:9781337912020
Author:Carl Warren, Ph.d. Cma William B. Tayler
Publisher:South-Western College Pub
Financial And Managerial Accounting
Accounting
ISBN:9781337902663
Author:WARREN, Carl S.
Publisher:Cengage Learning,
How to Estimate Project Costs: A Method for Cost Estimation; Author: Online PM Courses - Mike Clayton;https://www.youtube.com/watch?v=YQ2Wi3Jh3X0;License: Standard Youtube License