
Concept explainers
Videos
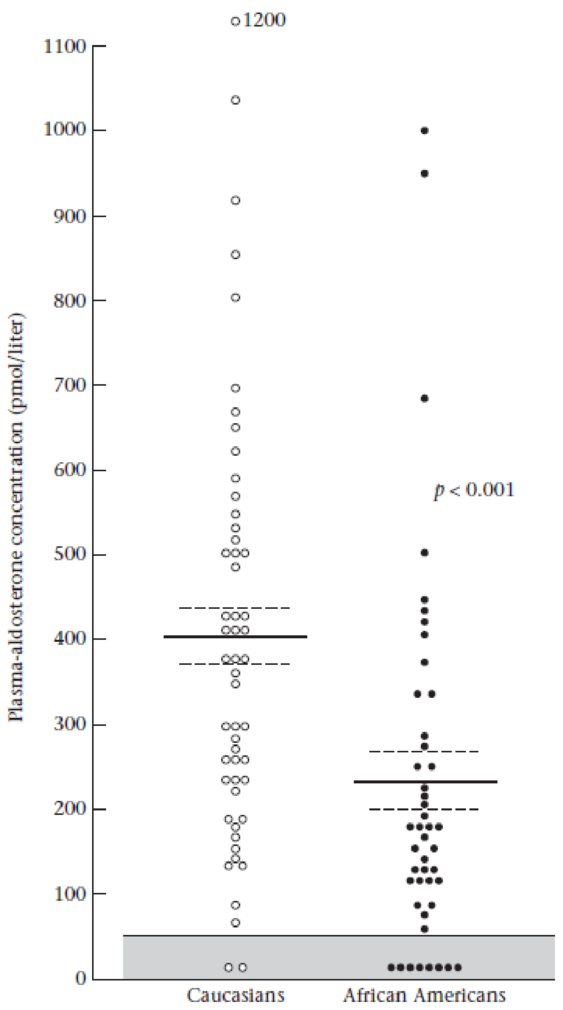
FIGURE 5.22 Plasma-aldosterone concentrations in 53 Caucasian and 46 African American children. Values within the shaded area were undetectable (< 50 pmol/L). The solid horizontal lines indicate the
Pregnant women with gestational diabetes mellitus (GDM) are at risk for long-term weight gain and subsequent development of type II diabetes. A pilot weight loss clinical trial was conducted where women with GDM were randomized to either an active intervention using a web-based delivery or a control intervention (Nicklas et al. [3]). Women were randomized at 6 weeks postpartum and then were seen at follow-up visits at 6 months and 12 months postpartum. At 12 months postpartum, women in the active group lost a mean of 0.2 lb. with a standard deviation of 15.4 lbs.
What is the
Hint: Make the same assumptions as in Problem 5.53.
Want to see the full answer?
Check out a sample textbook solution
Chapter 5 Solutions
Fundamentals of Biostatistics


- A marketing agency wants to determine whether different advertising platforms generate significantly different levels of customer engagement. The agency measures the average number of daily clicks on ads for three platforms: Social Media, Search Engines, and Email Campaigns. The agency collects data on daily clicks for each platform over a 10-day period and wants to test whether there is a statistically significant difference in the mean number of daily clicks among these platforms. Conduct ANOVA test. You can provide your answer by inserting a text box and the answer must include: also please provide a step by on getting the answers in excel Null hypothesis, Alternative hypothesis, Show answer (output table/summary table), and Conclusion based on the P value.arrow_forwardA company found that the daily sales revenue of its flagship product follows a normal distribution with a mean of $4500 and a standard deviation of $450. The company defines a "high-sales day" that is, any day with sales exceeding $4800. please provide a step by step on how to get the answers Q: What percentage of days can the company expect to have "high-sales days" or sales greater than $4800? Q: What is the sales revenue threshold for the bottom 10% of days? (please note that 10% refers to the probability/area under bell curve towards the lower tail of bell curve) Provide answers in the yellow cellsarrow_forwardBusiness Discussarrow_forward
- The following data represent total ventilation measured in liters of air per minute per square meter of body area for two independent (and randomly chosen) samples. Analyze these data using the appropriate non-parametric hypothesis testarrow_forwardeach column represents before & after measurements on the same individual. Analyze with the appropriate non-parametric hypothesis test for a paired design.arrow_forwardShould you be confident in applying your regression equation to estimate the heart rate of a python at 35°C? Why or why not?arrow_forward
 Glencoe Algebra 1, Student Edition, 9780079039897...AlgebraISBN:9780079039897Author:CarterPublisher:McGraw Hill
 Holt Mcdougal Larson Pre-algebra: Student Edition...AlgebraISBN:9780547587776Author:HOLT MCDOUGALPublisher:HOLT MCDOUGAL
 Big Ideas Math A Bridge To Success Algebra 1: Stu...AlgebraISBN:9781680331141Author:HOUGHTON MIFFLIN HARCOURTPublisher:Houghton Mifflin Harcourt