Videos
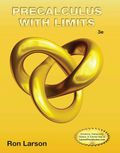
To sketch: the period of the given function.
Explanation of Solution
Given information:
Given function is
Calculation:
The vertical asymptotes for
So for the given equation, let us we find out the values of the two consecutive asymptotes.
On comparing we get,
Also,
Therefore, the two consecutive asymptotes occur at
Next, we calculate the values of
For example,
Substituting
We get,
Similarly, we calculate other values of
| 0 | |||||
| Not defined | Not defined |
Now using these values, let us plot the graph from
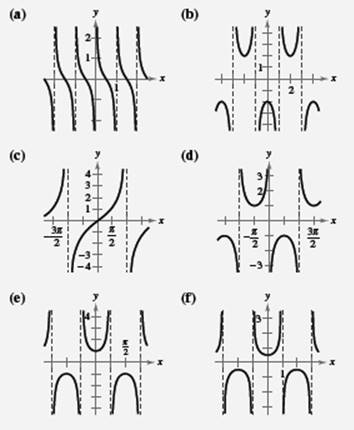
The above graph represents the equation
Thus, the correct option is (e) and the period of the given function is
Chapter 4 Solutions
EBK PRECALCULUS W/LIMITS


- Exercise 11.3 A slope field is given for the equation y' = 4y+4. (a) Sketch the particular solution that corresponds to y(0) = −2 (b) Find the constant solution (c) For what initial conditions y(0) is the solution increasing? (d) For what initial conditions y(0) is the solution decreasing? (e) Verify these results using only the differential equation y' = 4y+4.arrow_forwardAphids are discovered in a pear orchard. The Department of Agriculture has determined that the population of aphids t hours after the orchard has been sprayed is approximated by N(t)=1800−3tln(0.17t)+t where 0<t≤1000. Step 1 of 2: Find N(63). Round to the nearest whole number.arrow_forward3. [-/3 Points] DETAILS MY NOTES SCALCET8 7.4.032. ASK YOUR TEACHER PRACTICE ANOTHER Evaluate the integral. X + 4x + 13 Need Help? Read It SUBMIT ANSWER dxarrow_forward
- Evaluate the limit, and show your answer to 4 decimals if necessary. Iz² - y²z lim (x,y,z)>(9,6,4) xyz 1 -arrow_forwardlim (x,y) (1,1) 16x18 - 16y18 429-4y⁹arrow_forwardEvaluate the limit along the stated paths, or type "DNE" if the limit Does Not Exist: lim xy+y³ (x,y)(0,0) x²+ y² Along the path = = 0: Along the path y = = 0: Along the path y = 2x:arrow_forward
- show workarrow_forwardA graph of the function f is given below: Study the graph of ƒ at the value given below. Select each of the following that applies for the value a = 1 Of is defined at a. If is not defined at x = a. Of is continuous at x = a. If is discontinuous at x = a. Of is smooth at x = a. Of is not smooth at = a. If has a horizontal tangent line at = a. f has a vertical tangent line at x = a. Of has a oblique/slanted tangent line at x = a. If has no tangent line at x = a. f(a + h) - f(a) lim is finite. h→0 h f(a + h) - f(a) lim h->0+ and lim h h->0- f(a + h) - f(a) h are infinite. lim does not exist. h→0 f(a+h) - f(a) h f'(a) is defined. f'(a) is undefined. If is differentiable at x = a. If is not differentiable at x = a.arrow_forwardThe graph below is the function f(z) 4 3 -2 -1 -1 1 2 3 -3 Consider the function f whose graph is given above. (A) Find the following. If a function value is undefined, enter "undefined". If a limit does not exist, enter "DNE". If a limit can be represented by -∞o or ∞o, then do so. lim f(z) +3 lim f(z) 1-1 lim f(z) f(1) = 2 = -4 = undefined lim f(z) 1 2-1 lim f(z): 2-1+ lim f(x) 2+1 -00 = -2 = DNE f(-1) = -2 lim f(z) = -2 1-4 lim f(z) 2-4° 00 f'(0) f'(2) = = (B) List the value(s) of x for which f(x) is discontinuous. Then list the value(s) of x for which f(x) is left- continuous or right-continuous. Enter your answer as a comma-separated list, if needed (eg. -2, 3, 5). If there are none, enter "none". Discontinuous at z = Left-continuous at x = Invalid use of a comma.syntax incomplete. Right-continuous at z = Invalid use of a comma.syntax incomplete. (C) List the value(s) of x for which f(x) is non-differentiable. Enter your answer as a comma-separated list, if needed (eg. -2, 3, 5).…arrow_forward
- A graph of the function f is given below: Study the graph of f at the value given below. Select each of the following that applies for the value a = -4. f is defined at = a. f is not defined at 2 = a. If is continuous at x = a. Of is discontinuous at x = a. Of is smooth at x = a. f is not smooth at x = a. If has a horizontal tangent line at x = a. f has a vertical tangent line at x = a. Of has a oblique/slanted tangent line at x = a. Of has no tangent line at x = a. f(a + h) − f(a) h lim is finite. h→0 f(a + h) - f(a) lim is infinite. h→0 h f(a + h) - f(a) lim does not exist. h→0 h f'(a) is defined. f'(a) is undefined. If is differentiable at x = a. If is not differentiable at x = a.arrow_forwardFind the point of diminishing returns (x,y) for the function R(X), where R(x) represents revenue (in thousands of dollars) and x represents the amount spent on advertising (in thousands of dollars). R(x) = 10,000-x3 + 42x² + 700x, 0≤x≤20arrow_forwardDifferentiate the following functions. (a) y(x) = x³+6x² -3x+1 (b) f(x)=5x-3x (c) h(x) = sin(2x2)arrow_forward
 Calculus: Early TranscendentalsCalculusISBN:9781285741550Author:James StewartPublisher:Cengage Learning
 Thomas' Calculus (14th Edition)CalculusISBN:9780134438986Author:Joel R. Hass, Christopher E. Heil, Maurice D. WeirPublisher:PEARSON
 Calculus: Early Transcendentals (3rd Edition)CalculusISBN:9780134763644Author:William L. Briggs, Lyle Cochran, Bernard Gillett, Eric SchulzPublisher:PEARSON
 Calculus: Early TranscendentalsCalculusISBN:9781319050740Author:Jon Rogawski, Colin Adams, Robert FranzosaPublisher:W. H. Freeman
 Calculus: Early Transcendental FunctionsCalculusISBN:9781337552516Author:Ron Larson, Bruce H. EdwardsPublisher:Cengage Learning