Concept explainers
Videos
To sketch: the graph of the given function, to describe the behavior of the function as
Answer to Problem 76E
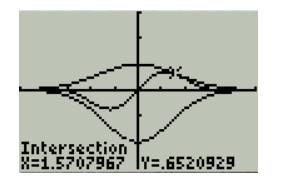
The intersection points are
Explanation of Solution
Given information:
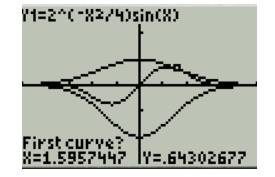
Given function
Calculation:
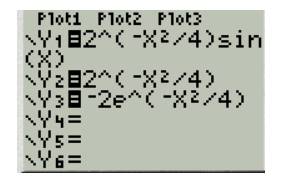
To plot this function in TI-83, proceed as below:
Press the button
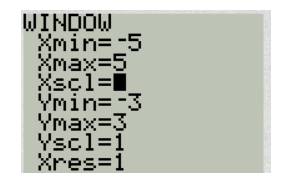
Press the button WINDOW and adjust the window as shown:
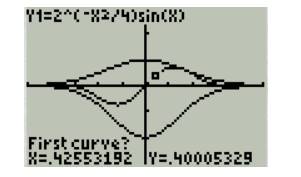
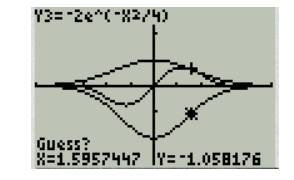
Press the button TRACE or GRAPH to obtain the graph:
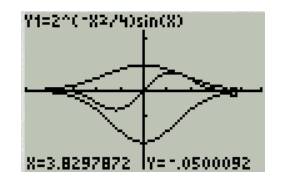
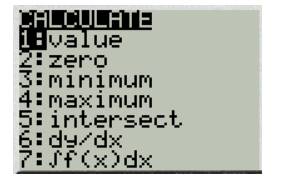
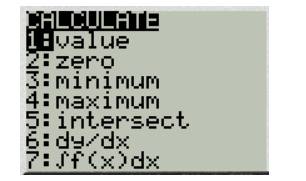
Now to find the intersection point, press the button 2nd CALC select option “5”
Move cursor on
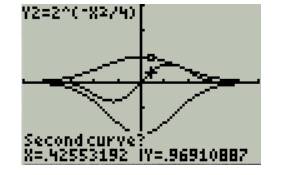
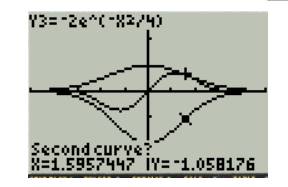
Move cursor on
Move cursor near point of intersection of graphs and press ENTER
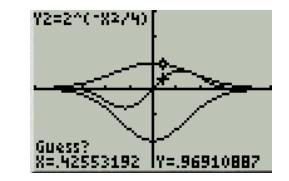
It will show following coordinates.
Now to find the second intersection, press the button 2nd CALC select option “5”
Move cursor on
Move cursor on
Move cursor near point of intersection of graphs and press ENTER
It will show following coordinates.
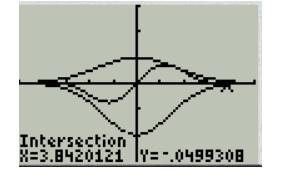
Hence the intersection points are
Chapter 4 Solutions
EBK PRECALCULUS W/LIMITS


- Show that i cote +1 = cosec 20 tan 20+1 = sec² O २ cos² + sin 20 = 1 using pythagon's theoremarrow_forwardFind the general solution to the differential equationarrow_forwardcharity savings Budget for May travel food Peter earned $700 during May. The graph shows how the money was used. What fraction was clothes? O Search Submit clothes leisurearrow_forward
- Exercise 11.3 A slope field is given for the equation y' = 4y+4. (a) Sketch the particular solution that corresponds to y(0) = −2 (b) Find the constant solution (c) For what initial conditions y(0) is the solution increasing? (d) For what initial conditions y(0) is the solution decreasing? (e) Verify these results using only the differential equation y' = 4y+4.arrow_forwardAphids are discovered in a pear orchard. The Department of Agriculture has determined that the population of aphids t hours after the orchard has been sprayed is approximated by N(t)=1800−3tln(0.17t)+t where 0<t≤1000. Step 1 of 2: Find N(63). Round to the nearest whole number.arrow_forward3. [-/3 Points] DETAILS MY NOTES SCALCET8 7.4.032. ASK YOUR TEACHER PRACTICE ANOTHER Evaluate the integral. X + 4x + 13 Need Help? Read It SUBMIT ANSWER dxarrow_forward
- Evaluate the limit, and show your answer to 4 decimals if necessary. Iz² - y²z lim (x,y,z)>(9,6,4) xyz 1 -arrow_forwardlim (x,y) (1,1) 16x18 - 16y18 429-4y⁹arrow_forwardEvaluate the limit along the stated paths, or type "DNE" if the limit Does Not Exist: lim xy+y³ (x,y)(0,0) x²+ y² Along the path = = 0: Along the path y = = 0: Along the path y = 2x:arrow_forward
- show workarrow_forwardA graph of the function f is given below: Study the graph of ƒ at the value given below. Select each of the following that applies for the value a = 1 Of is defined at a. If is not defined at x = a. Of is continuous at x = a. If is discontinuous at x = a. Of is smooth at x = a. Of is not smooth at = a. If has a horizontal tangent line at = a. f has a vertical tangent line at x = a. Of has a oblique/slanted tangent line at x = a. If has no tangent line at x = a. f(a + h) - f(a) lim is finite. h→0 h f(a + h) - f(a) lim h->0+ and lim h h->0- f(a + h) - f(a) h are infinite. lim does not exist. h→0 f(a+h) - f(a) h f'(a) is defined. f'(a) is undefined. If is differentiable at x = a. If is not differentiable at x = a.arrow_forwardThe graph below is the function f(z) 4 3 -2 -1 -1 1 2 3 -3 Consider the function f whose graph is given above. (A) Find the following. If a function value is undefined, enter "undefined". If a limit does not exist, enter "DNE". If a limit can be represented by -∞o or ∞o, then do so. lim f(z) +3 lim f(z) 1-1 lim f(z) f(1) = 2 = -4 = undefined lim f(z) 1 2-1 lim f(z): 2-1+ lim f(x) 2+1 -00 = -2 = DNE f(-1) = -2 lim f(z) = -2 1-4 lim f(z) 2-4° 00 f'(0) f'(2) = = (B) List the value(s) of x for which f(x) is discontinuous. Then list the value(s) of x for which f(x) is left- continuous or right-continuous. Enter your answer as a comma-separated list, if needed (eg. -2, 3, 5). If there are none, enter "none". Discontinuous at z = Left-continuous at x = Invalid use of a comma.syntax incomplete. Right-continuous at z = Invalid use of a comma.syntax incomplete. (C) List the value(s) of x for which f(x) is non-differentiable. Enter your answer as a comma-separated list, if needed (eg. -2, 3, 5).…arrow_forward
 Calculus: Early TranscendentalsCalculusISBN:9781285741550Author:James StewartPublisher:Cengage Learning
 Thomas' Calculus (14th Edition)CalculusISBN:9780134438986Author:Joel R. Hass, Christopher E. Heil, Maurice D. WeirPublisher:PEARSON
 Calculus: Early Transcendentals (3rd Edition)CalculusISBN:9780134763644Author:William L. Briggs, Lyle Cochran, Bernard Gillett, Eric SchulzPublisher:PEARSON
 Calculus: Early TranscendentalsCalculusISBN:9781319050740Author:Jon Rogawski, Colin Adams, Robert FranzosaPublisher:W. H. Freeman
 Calculus: Early Transcendental FunctionsCalculusISBN:9781337552516Author:Ron Larson, Bruce H. EdwardsPublisher:Cengage Learning