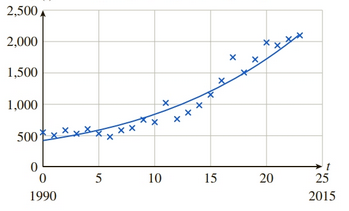
Big Brother The following chart shows the total number of wiretaps authorized each year by U.S. state courts from 1990 to 2013. ( t = 0 represents1990.) 45 N(t) Wiretap orders, state counts only These data can be approximated by the model N ( t ) = 410 e 0.071 t ( 0 ≤ t ≤ 23 ) a. Find N ( 20 ) and N ' ( 20 ) . Be sure to state the units of measurement. To how many significant digits should we round the answers? Why? b. The number of people whose communications are intercepted averages around 100 per wiretap order. What does the answer to part (a) tell you about the number of people whose communications were intercepted? c. According to the model, the number of wiretap orders each year (choose one) (A) increased at a linear rate (B) decreased at a quadratic rate (C) increased at an exponential rate (D) increased at a logarithmic rate over the period shown.
Big Brother The following chart shows the total number of wiretaps authorized each year by U.S. state courts from 1990 to 2013. ( t = 0 represents1990.) 45 N(t) Wiretap orders, state counts only These data can be approximated by the model N ( t ) = 410 e 0.071 t ( 0 ≤ t ≤ 23 ) a. Find N ( 20 ) and N ' ( 20 ) . Be sure to state the units of measurement. To how many significant digits should we round the answers? Why? b. The number of people whose communications are intercepted averages around 100 per wiretap order. What does the answer to part (a) tell you about the number of people whose communications were intercepted? c. According to the model, the number of wiretap orders each year (choose one) (A) increased at a linear rate (B) decreased at a quadratic rate (C) increased at an exponential rate (D) increased at a logarithmic rate over the period shown.
Solution Summary: The author calculates the value of N(20) and Nprime 'left' in the approximated model. The total number of wiretaps authorized by U.S. state
Big Brother The following chart shows the total number of wiretaps authorized each year by U.S. state courts from 1990 to 2013. (
t
=
0
represents1990.)45N(t) Wiretap orders, state counts only
These data can be approximated by the model
N
(
t
)
=
410
e
0.071
t
(
0
≤
t
≤
23
)
a. Find
N
(
20
)
and
N
'
(
20
)
. Be sure to state the units of measurement. To how many significant digits should we round the answers? Why?
b. The number of people whose communications are intercepted averages around 100 per wiretap order. What does the answer to part (a) tell you about the number of people whose communications were intercepted?
c. According to the model, the number of wiretap orders each year (choose one)
(A) increased at a linear rate
(B) decreased at a quadratic rate
(C) increased at an exponential rate
(D) increased at a logarithmic rate over the period shown.
Consider the function f(x) = x²-1.
(a) Find the instantaneous rate of change of f(x) at x=1 using the definition of the derivative.
Show all your steps clearly.
(b) Sketch the graph of f(x) around x = 1. Draw the secant line passing through the points on the
graph where x 1 and x->
1+h (for a small positive value of h, illustrate conceptually). Then,
draw the tangent line to the graph at x=1. Explain how the slope of the tangent line relates to the
value you found in part (a).
(c) In a few sentences, explain what the instantaneous rate of change of f(x) at x = 1 represents in
the context of the graph of f(x). How does the rate of change of this function vary at different
points?
1. The graph of ƒ is given. Use the graph to evaluate each of the following values. If a value does not exist,
state that fact.
и
(a) f'(-5)
(b) f'(-3)
(c) f'(0)
(d) f'(5)
2. Find an equation of the tangent line to the graph of y = g(x) at x = 5 if g(5) = −3 and g'(5)
=
4.
-
3. If an equation of the tangent line to the graph of y = f(x) at the point where x 2 is y = 4x — 5, find ƒ(2)
and f'(2).
Need a deep-dive on the concept behind this application? Look no further. Learn more about this topic, calculus and related others by exploring similar questions and additional content below.
Correlation Vs Regression: Difference Between them with definition & Comparison Chart; Author: Key Differences;https://www.youtube.com/watch?v=Ou2QGSJVd0U;License: Standard YouTube License, CC-BY
Correlation and Regression: Concepts with Illustrative examples; Author: LEARN & APPLY : Lean and Six Sigma;https://www.youtube.com/watch?v=xTpHD5WLuoA;License: Standard YouTube License, CC-BY


 Algebra & Trigonometry with Analytic GeometryAlgebraISBN:9781133382119Author:SwokowskiPublisher:Cengage
 Trigonometry (MindTap Course List)TrigonometryISBN:9781337278461Author:Ron LarsonPublisher:Cengage Learning

 Algebra for College StudentsAlgebraISBN:9781285195780Author:Jerome E. Kaufmann, Karen L. SchwittersPublisher:Cengage Learning