
Concept explainers
Videos
Market Share: Smartphones The following graph shows the approximate market shares, in percentage points, of smartphones using apple’s iOS operating system and Microsoft’s Windows Phone operating system, from the second quarter of 2011 to 2014. (t is time in years and
Market share (%)
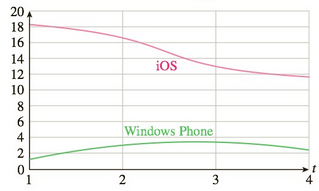
Le t
a. What does the function
measure? What does its derivative
measure?
| Android: |
|
|
|
|
b. The graph suggests that, On the interval
is
(A) increasing..
(B) decreasing.
(C) increasing the decreasing.
(D) decreasing, then increasing.
c. The two market shares are approximated by
|
|
|
|
|
|
Compute
(B) negative.
(C) positive, then negative.
(D) negative, then positive.
How is this behavior reflected in the graph, and what does it mean about the market shares of the iOS and Windows Phone operating systems?
b. Compute
Want to see the full answer?
Check out a sample textbook solution
Chapter 4 Solutions
Applied Calculus


- R₂ = X2 2) slots per pole per phase 3/31 msl 180 60 Kd Ka Sin (1) Isin (6) sin(30) Sin (30) اذا ميريد شرح الكتب بس 0 بالفراغ 3) Cos (30) 0.866 4) Rotating 5) Synchronous speed, 120*50 1000 6 S = 1000-950 1000 Copper bosses: 5kw Rotor input 5 0.05 : loo kw 6) 1 اذا ميريد شرح الكتب فقط 100 7) rotor DC ined sove in peaper I need a detailed solution on paper please Find the general solution of the following equations: Q2lyl-4y+13y=esinx. Find the general solution of the following equations: " Qly (49) - 16y= 0. 151arrow_forward۳/۱ R₂ = X2 2) slots per pole per phase = 3/31 B-18060 msl kd Kasi Sin (1) I sin (6) sin(30) Sin (30) اذا ميريد شرح الكتب بس 0 بالفراغ 3) Cos (30) 0.866 4) Rotating 5) Synchronous speed s = 1000-950 1000 Copper losses: 5kw Rotor input 5 0.05 6) 1 120 x 50 G loo kw اذا میرید شرح الكتب فقط look 7) rotor DC ined sove in peaper I need a detailed solution on paper dy please 04 12=-cosx.y + 2cosx with y(x) = 1 か 'Oy + xlny + xe")dx + (xsiny + xlnx +*dy=0. 01arrow_forward٣/١ R2X2 2) slots per pole per phase = 3/31 B, 18060 msl kd Kas Sin (1) 1sin() sin(30) Sin (30) اذا ميريد شرح الكتب بس 0 بالفراغ 3) Cos (30) 0.866 4) Rotating 5) Synchronous speeds S = 1000-950 1000 Copper bosses 5kw 120*50 loca G Rotor input 5 loo kw 0.05 6) 1 اذا ميريد شرح الكتب فقط lookw 7) rotor ined sove in peaper I need a detailed solution on paper please DC 口 04 on its wheels as shown in figure. The the door is 8 m below the free surface o is located at the center of the d no water leaks an accident and lands at the bottom of the lake 12m high and I m wide, and the top edge of water Determine the hydrostatic force on the discuss if the driver can open the door, if ong person can lift 100 kg, the passenger The door can be approximated as a vertical rec | 279|-|(23+2+12+20=2) AA Find the general solution of the following equations: 11 - 1/4+xy/-(1-x²³)= 0. 2arrow_forward
- ۳/۱ : +0 العنوان I need a detailed drawing with explanation R₂ = X2 2) slots per pole per phase 3/31 Le msl 180 60 Kd Ka Sin (1) Isin (6) sin(30) Sin (30) اذا ميريد شرح الكتب بس 0 بالفراغ 3) Cos (30) 0.866 4) Rotating 5) Synchronous speed, 120*50 1000 6 S = 1000-950 1000 Copper bosses: 5kw Rotor input 5 loo kw 0.05 6) 1 اذا ميريد شرح الكتب فقط ١٥٠ 7) rotov DC ined sove in peaper I need a detailed solution on paper please 064 Q1// Find the solution of: ( texty Q1// Find the solution of: '' y' -2y= 22% √y³arrow_forwardR2X2 2) slots per pole per phase = 3/31 B-180-60 msl kd Ka, Sin (1) I sin (6) sin(30) Sin (30) اذا ميريد شرح الكتب بس 0 بالفراغ 3) Cos (30) 0.866 4) Rotating 5) Synchronous speed s = 1000-950 1000 Copper losses 5kw 120 50 G Rotor input 5 loo kw 6) 1 ۳/۱ 0.05 إذا ميريد شرح الكتب فقط look 7) rotov DC ined sove in peaper I need a detailed solution on paper please Find the general solution of the following equations: " yll + 4y = tan2x. Find the general solution of the following equations: 01-24+7=0 T el [A] G ха =T Marrow_forwardR₂ = X2 2) slots per pole per phase = 3/31 B-18060 msl kd Kasi Sin (1) I sin (6) sin(30) Sin (30) اذا ميريد شرح الكتب بس 0 بالفراغ 3) Cos (30) 0.866 4) Rotating 5) Synchronous speed s = 1000-950 1000 Copper losses: 5kw Rotor input 5 0.05 6) 1 120 x 50 G loo kw اذا میرید شرح الكتب فقط look 7) rotor DC ined sove in peaper I need a detailed solution on paper please 0 64 Solve the following equations: = dx x²+y2 with y(0) = 1. 7357 Solve the following equations: dy x³+3xy² Q1// = dx 3x²y+y³° 01arrow_forward
- ٣/١ R2X2 2) slots per pole per phase = 3/3 1 B18060 msl Kd 3 Kol Sin (1) 1sin() sin(30) Sin (30) اذا میرید شرح الكتب بس 0 بالفراغ 3) cos (30) 0.866 4) Rotating 5) Synchronous speeds 120*50 G looo 1000-950 1000 50:05 Copper losses: 5kw Rotor input 5 loo kw 0.05 6) 1 اذا ميريد شرح الكتب فقط look 7) rotor DC ined sove in peaper I need a detailed solution on paper please 0 64 (Find the solution of the initial-valued problems: xy' + 2y = x³e* ;y(1) = 0 Q1// Find the solution of: (1) y' + ytqpx = see²x y³arrow_forwardA fluid has density 800 kg/m³ and flows with velocity v = xi + yj + zk, where x, y, and z are measured in meters, and the components of u are measured in meters per second. Find the rate of flow outward through the part of the paraboloid z = 64 - x² - y² that lies above the xy plane.arrow_forward۳/۱ : +0 العنوان I need a detailed drawing with explanation R₂ = X2 2) slots per pole per phase 3/31 Le msl 180 60 Kd Ka Sin (1) Isin (6) sin(30) Sin (30) اذا ميريد شرح الكتب بس 0 بالفراغ 3) Cos (30) 0.866 4) Rotating 5) Synchronous speed, 120 x 50 S = 1000-950 1000 Copper bosses: 5kw Rotor input 5 6 : loo kw 6) 1 0.05 اذا ميريد شرح الكتب فقط 100 7) rotor DC 1000 ined sove in peaper I need a detailed solution on paper please // Find the solution of: |(2xy³ + 4x)y' = x²y² + y² 351 // Find the solution of: (1) 2xyy' = 1+ y² 01 175 T Τ Marrow_forward
- Find the flux of the vector field F = (y,−x, 2²) through the helicoid with parameterization r(u, v) = (u cos v, u sin v, v) 0 ≤ u≤ 3, 0 ≤v≤ oriented away from the origin.arrow_forward5. The graph of ƒ is given below. Sketch a graph of f'. 6. The graph of ƒ is given below. Sketch a graph of f'. 0 x 7. The graph of ƒ is given below. List the x-values where f is not differentiable. 0 A 2 4arrow_forward2. DRAW a picture, label using variables to represent each component, set up an equation to relate the variables, then differentiate the equation to solve the problem below. The top of a ladder slides down a vertical wall at a rate of 0.15 m/s. At the moment when the bottom of the ladder is 3 m from the wall, it slides away from the wall at a rate of 0.2 m/s. How long is the ladder?arrow_forward

 College AlgebraAlgebraISBN:9781305115545Author:James Stewart, Lothar Redlin, Saleem WatsonPublisher:Cengage Learning
 Glencoe Algebra 1, Student Edition, 9780079039897...AlgebraISBN:9780079039897Author:CarterPublisher:McGraw Hill
 Algebra and Trigonometry (MindTap Course List)AlgebraISBN:9781305071742Author:James Stewart, Lothar Redlin, Saleem WatsonPublisher:Cengage Learning
 Algebra & Trigonometry with Analytic GeometryAlgebraISBN:9781133382119Author:SwokowskiPublisher:Cengage
 College Algebra (MindTap Course List)AlgebraISBN:9781305652231Author:R. David Gustafson, Jeff HughesPublisher:Cengage Learning