Concept explainers
(a)
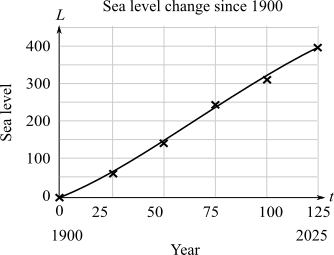
To calculate: The rate of increase of sea level in

(b)
To calculate: The rate of increase in sea level in

(c)
To graph: The sketch of the function L for

(d)
The comments on the assertion according to James Stewart who is a summer intern at Duffin House publishers, that “the cubic curve comes from doing a regression on original data and therefore reflects the actual trend of the data and this is reality and cannot argue against reality”.
Want to see the full answer?
Check out a sample textbook solution
Chapter 4 Solutions
Applied Calculus
- 8:39 *** TEMU 5G 60% A ferris wheel is 28 meters in diameter and boarded from a platform that is 2 meters above the ground. The six o'clock position on the ferris wheel is level with the loading platform. The wheel completes 1 full revolution in 4 minutes. The function h = f(t) gives your height in meters above the ground t minutes after the wheel begins to turn. What is the amplitude? 14 meters What is the equation of the Midline? y = 16 What is the period? 4 meters minutes The equation that models the height of the ferris wheel after t minutes is: f(t): = ƒ (3) = ·−14(0) + 16 syntax error: you gave an equation, not an expression. syntax error. Check your variables - you might be using an incorrect one. How high are you off of the ground after 3 minutes? Round your answe the nearest meter. ||| <arrow_forwardcan you solve this question step by step pleasearrow_forwardS cosx dx sin -3/ (x) Xarrow_forward
- The evolution of a population of Hippos, R(t), in hundreds, time in years, in an African National Park is given by the equation, dR dt (a) Solve the system exactly for R(t). = R(7 – R); R(0) = 3 2 (b) What happens as the time t → ∞o, i.e. what is the population a long time in the future? (c) Write an Euler scheme and compute until the population levels off (using Excel, Matlab, Octave, LibreCalc or similar). Do it twice, once with At = 0.1 and once with At = 0.05. (d) Plot all of your solutions on the same set of axes and comment.arrow_forwardfind For triangle ABC, with vertices A = (3,-1,2), B = (-5,4,-4) and C = (6, −1, −1), (a) the length of side AB, (b) the equation of the line that passes through A and B, (c) the angle at vertex B, (d) a vector perpendicular to the plane containing the triangle ABC, (e) the area of the triangle ABC. (f) the equation of a plane passing through A, B and C.arrow_forwardShowing all working, use the row reduction method to find the inverse of B, given by 5 -1 B = -3 1 3 1 -3 2arrow_forward
- Consider the matrix A, given by +63) A = 1 -3 4 -3 4 5 -105 (a) Find the determinant of the matrix, A. (b) Find all possible solutions, x, to the system Ax = b, where b is the column vector, (1,2, −4).arrow_forwardIf a (1,4,2) and b = (−1, −5,3), find |a|, a + b, 3a - 2b, a b, a x b and b × a. What is the angle between a and b?arrow_forwardShowing all working, find the eigenvalues and corresponding eigenvectors of -3 (a) (27) 6arrow_forward
 Algebra & Trigonometry with Analytic GeometryAlgebraISBN:9781133382119Author:SwokowskiPublisher:Cengage
 Glencoe Algebra 1, Student Edition, 9780079039897...AlgebraISBN:9780079039897Author:CarterPublisher:McGraw Hill
 College Algebra (MindTap Course List)AlgebraISBN:9781305652231Author:R. David Gustafson, Jeff HughesPublisher:Cengage Learning
 Algebra and Trigonometry (MindTap Course List)AlgebraISBN:9781305071742Author:James Stewart, Lothar Redlin, Saleem WatsonPublisher:Cengage Learning


