
Videos
To graph : the function given by
Answer to Problem 106E
As the value of a increases the peak value of the graph increases and as the value of a decreases the peak value of the graph decreases.
As the value of b increases the graph shrinks and as the value of b decreases the graph rises.
As the value of c increases the graph moves towards + x -axis and as the value of c decreases the graph moves towards - x -axis.
As the value of d increases the graph moves towards + y -axis and as the value of d decreases the graph moves towards - y -axis.
Explanation of Solution
Given information: Given function is
Calculation:
The graph of
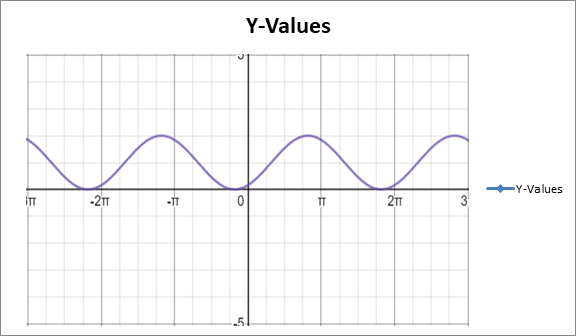
The graph of
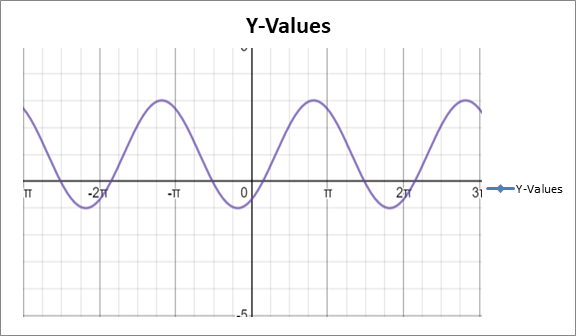
The graph of
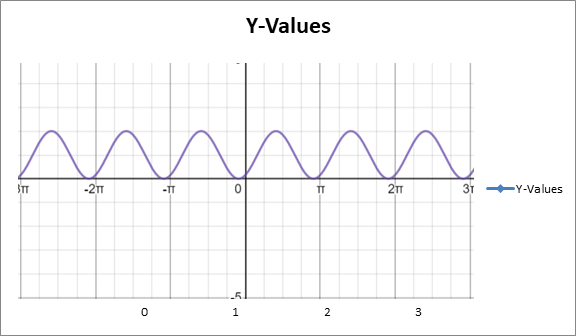
The graph of
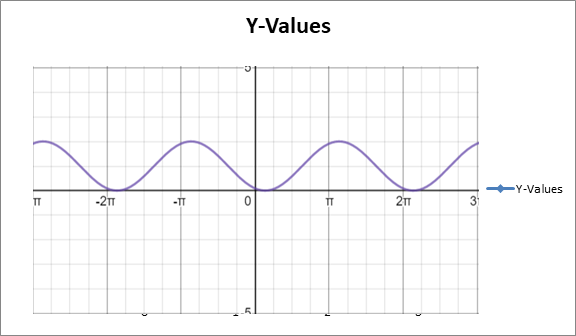
The graph of

It is clear from the graphs,
As the value of a increases the peak value of the graph increases and as the value of a decreases the peak value of the graph decreases.
As the value of b increases the graph shrinks and as the value of b decreases the graph rises.
As the value of c increases the graph moves towards + x -axis and as the value of c decreases the graph moves towards - x -axis.
As the value of d increases the graph moves towards + y -axis and as the value of d decreases the graph moves towards - y -axis.
Chapter 4 Solutions
PRECALCULUS W/LIMITS:GRAPH.APPROACH(HS)


- Find the accumulated amount A, if the principal P is invested at an interest rate of r per year for t years. (Round your answer to the nearest cent.) P = $3800, r = 4%, t = 10, compounded semiannually A = $ 5645.60 × Need Help? Read It SUBMIT ANSWER [3.33/6.66 Points] DETAILS MY NOTES REVIOUS ANSWERS ASK YOUR TEACHER TANAPCALC10 5.3.001.EP. PRACTICE ANOTHER Consider the following where the principal P is invested at an interest rate of r per year for t years. P = $3,100, r = 4%, t = 10, compounded semiannually Determine m, the number of conversion periods per year. 2 Find the accumulated amount A (in dollars). (Round your answer to the nearest cent.) A = $ 4604.44arrow_forwardForce with 800 N and 400 N are acting on a machine part at 30° and 60°, respectively with a positive x axis, Draw the diagram representing this situationarrow_forwardI forgot to mention to you to solve question 1 and 2. Can you solve it using all data that given in the pict i given and can you teach me about that.arrow_forward
 Calculus: Early TranscendentalsCalculusISBN:9781285741550Author:James StewartPublisher:Cengage Learning
 Thomas' Calculus (14th Edition)CalculusISBN:9780134438986Author:Joel R. Hass, Christopher E. Heil, Maurice D. WeirPublisher:PEARSON
 Calculus: Early Transcendentals (3rd Edition)CalculusISBN:9780134763644Author:William L. Briggs, Lyle Cochran, Bernard Gillett, Eric SchulzPublisher:PEARSON
 Calculus: Early TranscendentalsCalculusISBN:9781319050740Author:Jon Rogawski, Colin Adams, Robert FranzosaPublisher:W. H. Freeman
 Calculus: Early Transcendental FunctionsCalculusISBN:9781337552516Author:Ron Larson, Bruce H. EdwardsPublisher:Cengage Learning