
Concept explainers
Videos
a.
To find: a trigonometric model for C.
a.
Answer to Problem 100E
Explanation of Solution
Given information: A model for the temperature in Q is given by,
(in degree Fahrenheit) for Q and C for month t , with t =1 corresponding to January .
| Month t | Q | C |
| 1 | 47.1 | 31.0 |
| 2 | 49.1 | 35.3 |
| 3 | 51.4 | 46.6 |
| 4 | 54.8 | 59.0 |
| 5 | 59.5 | 70.0 |
| 6 | 63.1 | 79.7 |
| 7 | 67.4 | 84.1 |
| 8 | 68.6 | 81.9 |
| 9 | 66.2 | 74.8 |
| 10 | 58.2 | 62.3 |
| 11 | 50.3 | 48.2 |
| 12 | 46.0 | 34.8 |
Calculation:
From the table data trigonometric model for C is,
b.
To graph: the data and the model for the temperature in Q using graphing utility and to find how the model fits the data.
b.
Answer to Problem 100E
The model does not fit the data well.
Explanation of Solution
Given information: A model for the temperature in Q is given by,
(in degree Fahrenheit) for Q and C for month t , with t =1 corresponding to January .
| Month t | Q | C |
| 1 | 47.1 | 31.0 |
| 2 | 49.1 | 35.3 |
| 3 | 51.4 | 46.6 |
| 4 | 54.8 | 59.0 |
| 5 | 59.5 | 70.0 |
| 6 | 63.1 | 79.7 |
| 7 | 67.4 | 84.1 |
| 8 | 68.6 | 81.9 |
| 9 | 66.2 | 74.8 |
| 10 | 58.2 | 62.3 |
| 11 | 50.3 | 48.2 |
| 12 | 46.0 | 34.8 |
The graph of
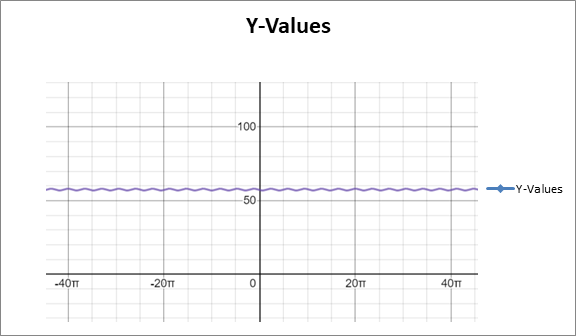
Calculation:
It is clear from the graph that the model does not fit the data well.
c.
To graph : the data and the model for the temperature in C using graphing utility and to find how does the model fit the data.
c.
Answer to Problem 100E
The model fits the data well.
Explanation of Solution
Given information: A model for the temperature in Q is given by,
(in degree Fahrenheit) for Q and C for month t , with t =1 corresponding to January .
| Month t | Q | C |
| 1 | 47.1 | 31.0 |
| 2 | 49.1 | 35.3 |
| 3 | 51.4 | 46.6 |
| 4 | 54.8 | 59.0 |
| 5 | 59.5 | 70.0 |
| 6 | 63.1 | 79.7 |
| 7 | 67.4 | 84.1 |
| 8 | 68.6 | 81.9 |
| 9 | 66.2 | 74.8 |
| 10 | 58.2 | 62.3 |
| 11 | 50.3 | 48.2 |
| 12 | 46.0 | 34.8 |
Calculation:
From the table data
graphing utility is given below.
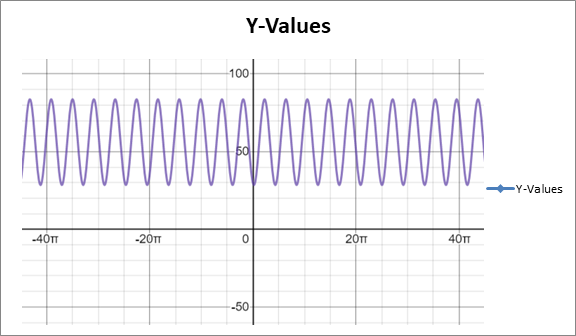
It is clear from the graph that the model fits the data well.
d.
To : use the models to estimate the average daily high temperature in each city.
d.
Answer to Problem 100E
So, C average daily high temperature is 84 degrees.
Explanation of Solution
Given information: A model for the temperature in Q is given by,
(in degree Fahrenheit) for Q and C for month t , with t =1 corresponding to January .
| Month t | Q | C |
| 1 | 47.1 | 31.0 |
| 2 | 49.1 | 35.3 |
| 3 | 51.4 | 46.6 |
| 4 | 54.8 | 59.0 |
| 5 | 59.5 | 70.0 |
| 6 | 63.1 | 79.7 |
| 7 | 67.4 | 84.1 |
| 8 | 68.6 | 81.9 |
| 9 | 66.2 | 74.8 |
| 10 | 58.2 | 62.3 |
| 11 | 50.3 | 48.2 |
| 12 | 46.0 | 34.8 |
Calculation:
C average daily high temperature =
So, C average daily high temperature is 84 degrees.
e.
To : find the period of each model.
e.
Answer to Problem 100E
C period=13.0, Q period=11.4.
Explanation of Solution
Given information: A model for the temperature in Q is given by,
(in degree Fahrenheit) for Q and C for month t , with t =1 corresponding to January .
| Month t | Q | C |
| 1 | 47.1 | 31.0 |
| 2 | 49.1 | 35.3 |
| 3 | 51.4 | 46.6 |
| 4 | 54.8 | 59.0 |
| 5 | 59.5 | 70.0 |
| 6 | 63.1 | 79.7 |
| 7 | 67.4 | 84.1 |
| 8 | 68.6 | 81.9 |
| 9 | 66.2 | 74.8 |
| 10 | 58.2 | 62.3 |
| 11 | 50.3 | 48.2 |
| 12 | 46.0 | 34.8 |
Calculation:
From the table data,
C period=13.0, Q period=11.4.
f.
To: find which city has the greatest variability in temperature throughout the year..
f.
Answer to Problem 100E
C has a greater temperature variability because it has a greater amplitude (27.6) compared to Q (11.1).
Explanation of Solution
Given information: A model for the temperature in Q is given by,
(in degree Fahrenheit) for Q and C for month t , with t =1 corresponding to January .
| Month t | Q | C |
| 1 | 47.1 | 31.0 |
| 2 | 49.1 | 35.3 |
| 3 | 51.4 | 46.6 |
| 4 | 54.8 | 59.0 |
| 5 | 59.5 | 70.0 |
| 6 | 63.1 | 79.7 |
| 7 | 67.4 | 84.1 |
| 8 | 68.6 | 81.9 |
| 9 | 66.2 | 74.8 |
| 10 | 58.2 | 62.3 |
| 11 | 50.3 | 48.2 |
| 12 | 46.0 | 34.8 |
Calculation:
From the table data C has a greater temperature variability because it has a greater amplitude (27.6) compared to Q (11.1).
Chapter 4 Solutions
PRECALCULUS W/LIMITS:GRAPH.APPROACH(HS)


- Force with 800 N and 400 N are acting on a machine part at 30° and 60°, respectively with a positive x axis, Draw the diagram representing this situationarrow_forwardI forgot to mention to you to solve question 1 and 2. Can you solve it using all data that given in the pict i given and can you teach me about that.arrow_forwardexam review please help!arrow_forward
 Calculus: Early TranscendentalsCalculusISBN:9781285741550Author:James StewartPublisher:Cengage Learning
 Thomas' Calculus (14th Edition)CalculusISBN:9780134438986Author:Joel R. Hass, Christopher E. Heil, Maurice D. WeirPublisher:PEARSON
 Calculus: Early Transcendentals (3rd Edition)CalculusISBN:9780134763644Author:William L. Briggs, Lyle Cochran, Bernard Gillett, Eric SchulzPublisher:PEARSON
 Calculus: Early TranscendentalsCalculusISBN:9781319050740Author:Jon Rogawski, Colin Adams, Robert FranzosaPublisher:W. H. Freeman
 Calculus: Early Transcendental FunctionsCalculusISBN:9781337552516Author:Ron Larson, Bruce H. EdwardsPublisher:Cengage Learning