
Videos
To graph: the function manually.
Explanation of Solution
Given information:
Need to create graph of function
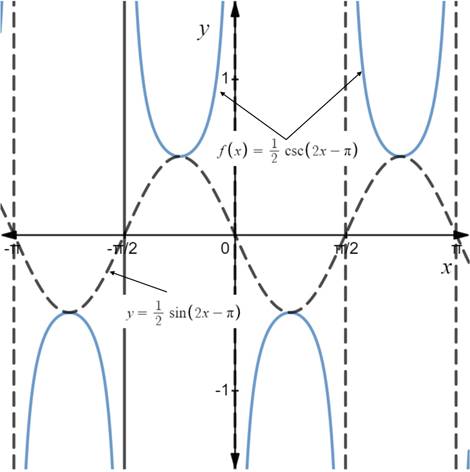
Graph:
Give function is
Lets first sketch the graph of
Amplitude of the function is
Period of the sine function is
So evaluate the value of
As value of sine function is zero at midpoint and endpoint of the interval
Corresponding cosecant function
Based on above calculation, Graph of
Chapter 4 Solutions
PRECALCULUS W/LIMITS:GRAPH.APPROACH(HS)


- Force with 800 N and 400 N are acting on a machine part at 30° and 60°, respectively with a positive x axis, Draw the diagram representing this situationarrow_forwardI forgot to mention to you to solve question 1 and 2. Can you solve it using all data that given in the pict i given and can you teach me about that.arrow_forwardexam review please help!arrow_forward
 Calculus: Early TranscendentalsCalculusISBN:9781285741550Author:James StewartPublisher:Cengage Learning
 Thomas' Calculus (14th Edition)CalculusISBN:9780134438986Author:Joel R. Hass, Christopher E. Heil, Maurice D. WeirPublisher:PEARSON
 Calculus: Early Transcendentals (3rd Edition)CalculusISBN:9780134763644Author:William L. Briggs, Lyle Cochran, Bernard Gillett, Eric SchulzPublisher:PEARSON
 Calculus: Early TranscendentalsCalculusISBN:9781319050740Author:Jon Rogawski, Colin Adams, Robert FranzosaPublisher:W. H. Freeman
 Calculus: Early Transcendental FunctionsCalculusISBN:9781337552516Author:Ron Larson, Bruce H. EdwardsPublisher:Cengage Learning