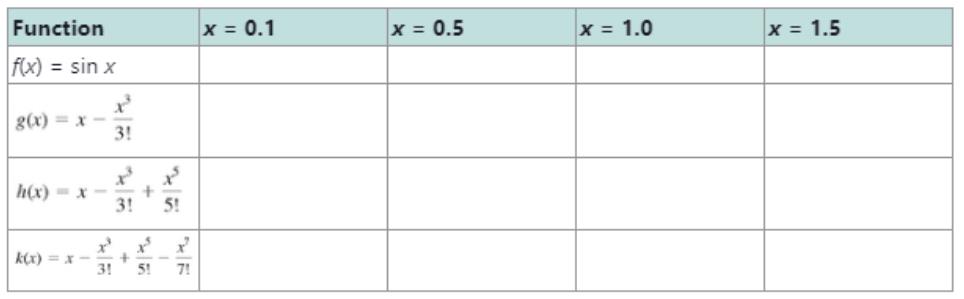
For Exercises 104-105, we demonstrate that trigonometric functions can be approximated by polynomial functions over a given interval in the domain. Graph functions f , g , h , and k on the viewing window − 4 ≤ x ≤ 4 , − 4 ≤ y ≤ 4 . Then use a Table feature on a graphing utility to evaluate each function for the given values of x . How do functions g , h , and k compare to function f for x values farther from 0 ?
For Exercises 104-105, we demonstrate that trigonometric functions can be approximated by polynomial functions over a given interval in the domain. Graph functions f , g , h , and k on the viewing window − 4 ≤ x ≤ 4 , − 4 ≤ y ≤ 4 . Then use a Table feature on a graphing utility to evaluate each function for the given values of x . How do functions g , h , and k compare to function f for x values farther from 0 ?
Solution Summary: The author explains how to graph functions using a graphing utility on the viewing window, f,g,handk.
For Exercises 104-105, we demonstrate that trigonometric functions can be approximated by polynomial functions over a given interval in the domain.
Graph functions
f
,
g
,
h
, and
k
on the viewing window
−
4
≤
x
≤
4
,
−
4
≤
y
≤
4
. Then use a Table feature on a graphing utility to evaluate each function for the given values of
x
. How do functions
g
,
h
, and
k
compare to function
f
for
x
values farther from
0
?
Given lim x-4 f (x) = 1,limx-49 (x) = 10, and lim→-4 h (x) = -7 use the limit properties
to find lim→-4
1
[2h (x) — h(x) + 7 f(x)] :
-
h(x)+7f(x)
3
O DNE
17. Suppose we know that the graph below is the graph of a solution to dy/dt = f(t).
(a) How much of the slope field can
you sketch from this information?
[Hint: Note that the differential
equation depends only on t.]
(b) What can you say about the solu-
tion with y(0) = 2? (For example,
can you sketch the graph of this so-
lution?)
y(0) = 1
y
AN
(b) Find the (instantaneous) rate of change of y at x = 5.
In the previous part, we found the average rate of change for several intervals of decreasing size starting at x = 5. The instantaneous rate of
change of fat x = 5 is the limit of the average rate of change over the interval [x, x + h] as h approaches 0. This is given by the derivative in the
following limit.
lim
h→0
-
f(x + h) − f(x)
h
The first step to find this limit is to compute f(x + h). Recall that this means replacing the input variable x with the expression x + h in the rule
defining f.
f(x + h) = (x + h)² - 5(x+ h)
=
2xh+h2_
x² + 2xh + h² 5✔
-
5
)x - 5h
Step 4
-
The second step for finding the derivative of fat x is to find the difference f(x + h) − f(x).
-
f(x + h) f(x) =
= (x²
x² + 2xh + h² -
])-
=
2x
+ h² - 5h
])x-5h) - (x² - 5x)
=
]) (2x + h - 5)
Macbook Pro
College Algebra with Modeling & Visualization (5th Edition)
Knowledge Booster
Learn more about
Need a deep-dive on the concept behind this application? Look no further. Learn more about this topic, calculus and related others by exploring similar questions and additional content below.


 College Algebra (MindTap Course List)AlgebraISBN:9781305652231Author:R. David Gustafson, Jeff HughesPublisher:Cengage Learning
 Glencoe Algebra 1, Student Edition, 9780079039897...AlgebraISBN:9780079039897Author:CarterPublisher:McGraw Hill
 Algebra & Trigonometry with Analytic GeometryAlgebraISBN:9781133382119Author:SwokowskiPublisher:Cengage
 Mathematics For Machine TechnologyAdvanced MathISBN:9781337798310Author:Peterson, John.Publisher:Cengage Learning,
 Algebra: Structure And Method, Book 1AlgebraISBN:9780395977224Author:Richard G. Brown, Mary P. Dolciani, Robert H. Sorgenfrey, William L. ColePublisher:McDougal Littell
 College AlgebraAlgebraISBN:9781305115545Author:James Stewart, Lothar Redlin, Saleem WatsonPublisher:Cengage Learning