
Videos
a.
To graph: showing the height with respect to time.
a.
Explanation of Solution
Given:
A person starts swinging from the ground, then attains a maximum height and then slows down until the swing stops.
Concept used:
Given example is of a damped oscillation where the swing is oscillating between its amplitude and due to damping force, its amplitude is continuously decreasing.
For a simple oscillation without damping the equation is
But as stated the height of the swing will first increase meaning that the amplitude will increase and then decrease, thus there will be 2 parts of the graph, one with increasing amplitude and one with decreasing amplitude.
The equation of graph for the part when swing starts from the ground and increases its amplitude will be
Here it must be noted that the power of eand value of
Thus the graph formed is given below.
Graph:
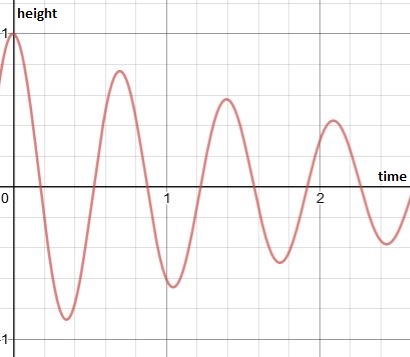
Interpretation:
The height of the swing gradually increases from 0 up to maximum height while passing through the mean position every time.
Here height at 0 doesn’t mean ground level but the mean height from the ground
Now, for the second part of the graph where the height of the swing decreases gradually until it stop, the equation will have cosine function as it starts from maximum value and ends at 0
So the equation for this graph will be
Conclusion:
The height of swing will decrease gradually because of the damped forces acting such as friction. Eventually the height becomes zero and the swing stops.
b.
To find: the change in the graph if instead of slowing down the person jumps from the swing.
b.
Answer to Problem 3P
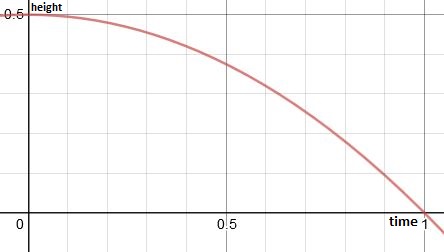
A parabola will be formed
Explanation of Solution
Given:
A person is swingfrom any point from him, and jumps to land on the ground.
Concept used:
When the person is swinging, he already has some momentum because of the motion of the swing.
If he jumps from the swing at any point he will follow a parabolic path because of his velocity in horizontal direction and due to the gravitational force in vertical direction
Due to the momentum the person will be launched into air from the swing and he will follow a parabolic path.
Graph:
The 1st part of graph will be similar as there are no changes while speeding up but the second part of graph will be different as given below.
Conclusion:
If the person jumps from the swing mid-air instead of slowing down, he follows a trajectory of a parabola.
Chapter 4 Solutions
EP ALGEBRA 1-ETEXT ACCESS
Additional Math Textbook Solutions
Algebra and Trigonometry (6th Edition)
College Algebra with Modeling & Visualization (5th Edition)
Thinking Mathematically (6th Edition)
Calculus for Business, Economics, Life Sciences, and Social Sciences (14th Edition)
A Problem Solving Approach To Mathematics For Elementary School Teachers (13th Edition)


- File Edit View History Bookmarks Profiles Tab Window Window Help Things Quadratics! Part 1 X SM◄))) 61% Fri 25 student.desmos.com/activitybuilder/instance/67b739e7356cae7898fd0dbd/student/67b8f115811d42186c239e23#screenid=41a95 ngs Quadratics! Part 1: Parabolas Mitchell 30 30 foo feet 20- 20 10 0 -10 FEB 21 3 10 10 80 FS F3 X Intercepts #2 20 20 Approximately how tall is the shooter? > Which intercept did you use to solve the above problem? x-intercept y-intercept 30 feet Explain your thinking. 1 √E Submit 00000 acBook stv 399 ? DOD 000 F4 % 5 W E R F5 A F6 F7 F9 & * 7 8 9 0 Y U C 014arrow_forwardThe table below shows the acreage, number of visitors, and total revenue of state parks and recreational areas in Massachusetts, New York, and Vermont in 2010. State Acreage (in thousands) Visitors (in thousands) Revenue (in thousands) Massachusetts 350 35,271 $12,644 New York 1,354 56,322 $85,558 Vermont 69 758 $10,969 Select the three true statements based on the data in the table. A. Vermont had the highest revenue per acre of state parks and recreational areas. B. Vermont had approximately 11 visitors per acre of state parks and recreational areas. C. New York had the highest number of visitors per acre of state parks and recreational areas. D. Massachusetts had approximately 36 visitors per acre of state parks and recreational areas. E. New York had revenue of approximately $63.19 per acre of state parks and recreational areas. F. Massachusetts had revenue of approximately $0.03 per acre of state parks and recreational areas.arrow_forwarda) show that the empty set and sigletonset are convex set. 6) show that every sub space of linear space X is convex but the convers heed not be true. c) let Mand N be two convex set of a linear Space X and KEF Show that MUN is conevex and (ii) M-N is convex or hot A and is MSN or NSM show that MUN convex or not, 385arrow_forward
- I write with prove one-to-one linear Sanction but not onto Lexample.) b) write with Prove on to linear function but not oh-to-on (example). c) write with prove example x=y St Xandy two linear space over Sielad F.arrow_forwardFind the sample space. Sunscreen SPF 10, 15, 30, 45, 50 Type Lotion, Spray, Gelarrow_forwardFor each graph below, state whether it represents a function. Graph 1 24y Graph 2 Graph 3 4 2 -8 -6 -4 -2 -2 2 4 6 Function? ○ Yes ○ No ○ Yes ○ No Graph 4 Graph 5 8 Function? Yes No Yes No -2. ○ Yes ○ No Graph 6 4 + 2 4 -8 -6 -4 -2 2 4 6 8 Yes -4++ Noarrow_forward
- Practice k Help ises A 96 Anewer The probability that you get a sum of at least 10 is Determine the number of ways that the specified event can occur when two number cubes are rolled. 1. Getting a sum of 9 or 10 3. Getting a sum less than 5 2. Getting a sum of 6 or 7 4. Getting a sum that is odd Tell whether you would use the addition principle or the multiplication principle to determine the total number of possible outcomes for the situation described. 5. Rolling three number cubes 6. Getting a sum of 10 or 12 after rolling three number cubes A set of playing cards contains four groups of cards designated by color (black, red, yellow, and green) with cards numbered from 1 to 14 in each group. Determine the number of ways that the specified event can occur when a card is drawn from the set. 7. Drawing a 13 or 14 9. Drawing a number less than 4 8. Drawing a yellow or green card 10. Drawing a black, red, or green car The spinner is divided into equal parts. Find the specified…arrow_forwardAnswer the questionsarrow_forwardHow can I prepare for me Unit 3 test in algebra 1? I am in 9th grade.arrow_forward
 Algebra and Trigonometry (6th Edition)AlgebraISBN:9780134463216Author:Robert F. BlitzerPublisher:PEARSON
 Contemporary Abstract AlgebraAlgebraISBN:9781305657960Author:Joseph GallianPublisher:Cengage Learning
 Linear Algebra: A Modern IntroductionAlgebraISBN:9781285463247Author:David PoolePublisher:Cengage Learning
 Algebra And Trigonometry (11th Edition)AlgebraISBN:9780135163078Author:Michael SullivanPublisher:PEARSON
 Introduction to Linear Algebra, Fifth EditionAlgebraISBN:9780980232776Author:Gilbert StrangPublisher:Wellesley-Cambridge Press
 College Algebra (Collegiate Math)AlgebraISBN:9780077836344Author:Julie Miller, Donna GerkenPublisher:McGraw-Hill Education