Concept explainers
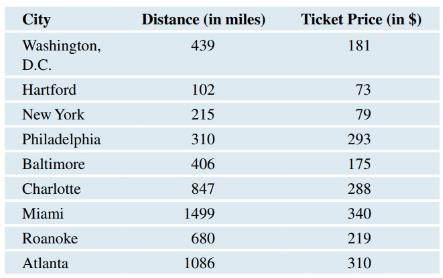
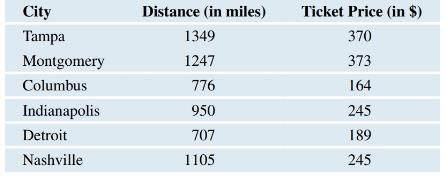
Distance and Train Ticket Price The following table gives the distance from Boston to each city and the cost of a train ticket from Boston to that city for a certain date.


a. Use technology to produce a
b. Compute
c. Provide an interpretation of the slope of the regression line.
d. Provide an interpretation of the y-intercept of the regression line or explain why it would not be appropriate to do so.
e. Use the regression equation to predict the cost of a train ticket from Boston to Pittsburgh, a distance of 572 miles.
Want to see the full answer?
Check out a sample textbook solution
Chapter 4 Solutions
INTRODUCTORY STATISTICS (LOOSELEAF)
Additional Math Textbook Solutions
Pathways To Math Literacy (looseleaf)
Elementary Algebra For College Students (10th Edition)
Beginning and Intermediate Algebra
College Algebra (7th Edition)
Graphical Approach To College Algebra
Elementary Statistics ( 3rd International Edition ) Isbn:9781260092561
- 5. Suppose that X is an integer valued random variable, and let mЄ N. Show that 8 11118 P(narrow_forward食食假 6. Show that I(AUB) = max{1{A}, I{B}} = I{A} + I{B} - I{A} I{B}; I(AB)= min{I{A}, I{B}} = I{A} I{B}; I{A A B} = I{A} + I{B}-21{A} I{B} = (I{A} - I{B})². -arrow_forward11. Suppose that the events (An, n ≥ 1) are independent. Show that the inclusion- exclusion formula reduces to P(UAL)-1-(1-P(Ak)). k=1 k=1arrow_forward12. (a) Explain tail events and the tail o-field. Give an example.arrow_forwardLet A, A1, A2,... be measurable sets. Then P(A)=1- P(A); • P(Ø) = 0; P(A1 UA2) ≤ P(A1) + P(A2); A1 C A2 P(A1) P(A2); P(UA) + P(n=14) = 1. Exercise 3.1 Prove these relations. ☐arrow_forward17. Suppose that X1, X2,..., Xn are random variables, such that E|xk| < ∞ for all k, and set Yn = max1arrow_forwardarrow_back_iosSEE MORE QUESTIONSarrow_forward_iosRecommended textbooks for you
 Glencoe Algebra 1, Student Edition, 9780079039897...AlgebraISBN:9780079039897Author:CarterPublisher:McGraw Hill
 Algebra and Trigonometry (MindTap Course List)AlgebraISBN:9781305071742Author:James Stewart, Lothar Redlin, Saleem WatsonPublisher:Cengage Learning
 College Algebra (MindTap Course List)AlgebraISBN:9781305652231Author:R. David Gustafson, Jeff HughesPublisher:Cengage Learning
 College AlgebraAlgebraISBN:9781305115545Author:James Stewart, Lothar Redlin, Saleem WatsonPublisher:Cengage Learning
 Functions and Change: A Modeling Approach to Coll...AlgebraISBN:9781337111348Author:Bruce Crauder, Benny Evans, Alan NoellPublisher:Cengage Learning
 Glencoe Algebra 1, Student Edition, 9780079039897...AlgebraISBN:9780079039897Author:CarterPublisher:McGraw Hill
 Algebra and Trigonometry (MindTap Course List)AlgebraISBN:9781305071742Author:James Stewart, Lothar Redlin, Saleem WatsonPublisher:Cengage Learning
 College Algebra (MindTap Course List)AlgebraISBN:9781305652231Author:R. David Gustafson, Jeff HughesPublisher:Cengage Learning
 College AlgebraAlgebraISBN:9781305115545Author:James Stewart, Lothar Redlin, Saleem WatsonPublisher:Cengage Learning
 Functions and Change: A Modeling Approach to Coll...AlgebraISBN:9781337111348Author:Bruce Crauder, Benny Evans, Alan NoellPublisher:Cengage Learning