
INTRODUCTORY STATISTICS (LOOSELEAF)
3rd Edition
ISBN: 9780135163146
Author: Gould
Publisher: PEARSON
expand_more
expand_more
format_list_bulleted
Concept explainers
Videos
Textbook Question
Chapter 4, Problem 3SE
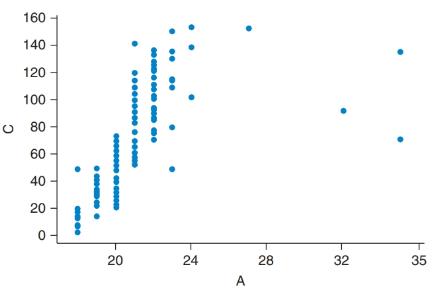
Age and Credits The
Expert Solution & Answer
Want to see the full answer?
Check out a sample textbook solution
Students have asked these similar questions
Exercise 6-6 (Algo) (LO6-3)
The director of admissions at Kinzua University in Nova Scotia estimated the distribution of student admissions for the fall semester on the basis of past experience.
Admissions
Probability
1,100
0.5
1,400
0.4
1,300
0.1
Click here for the Excel Data File
Required:
What is the expected number of admissions for the fall semester?
Compute the variance and the standard deviation of the number of admissions.
Note: Round your standard deviation to 2 decimal places.
1. Find the mean of the x-values (x-bar)
and the mean of the y-values (y-bar) and write/label each here:
2. Label the second row in the table using proper notation; then, complete the table. In the fifth and sixth
columns, show the 'products' of what you're multiplying, as well as the answers.
X
y
x minus x-bar y minus y-bar (x minus x-bar)(y minus y-bar)
(x minus x-bar)^2
xy
16
20
34
4-2
5 2
3. Write the sums that represents Sxx and Sxy in the table, at the bottom of their respective columns.
4. Find the slope of the Regression line: bi
=
(simplify your answer)
5. Find the y-intercept of the Regression line, and then write the equation of the Regression line.
Show your work. Then, BOX your final answer. Express your line as "y-hat equals...
Apply STATA commands & submit the output for each question only when
indicated below
i.
Generate the log of birthweight and family income of children. Name
these new variables Ibwght & Ifaminc. Include the output of this
code.
ii. Apply the command sum with the detail option to the variable
faminc. Note: you should find the 25th percentile value, the 50th
percentile and the 75th percentile value of faminc from the output -
you will need it to answer the next question Include the output of this
code.
iii.
iv.
Use the output from part ii of this question to Generate a variable
called "high_faminc" that takes a value 1 if faminc is less than or
equal to the 25th percentile, it takes the value 2 if faminc is greater
than 25th percentile but less than or equal to the 50th percentile, it
takes the value 3 if faminc is greater than 50th percentile but less than
or equal to the 75th percentile, it takes the value 4 if faminc is greater
than the 75th percentile. Include the outcome of this code…
Chapter 4 Solutions
INTRODUCTORY STATISTICS (LOOSELEAF)
Ch. 4 - GPA Predictors The scatterplots show SAT scores...Ch. 4 - Salary and Employment The first graph shows the...Ch. 4 - Age and Credits The scatterplot below shows data...Ch. 4 - Age and GPA The scatterplot shows data on age and...Ch. 4 - Credits and GPA (Example 1) The scatterplot shows...Ch. 4 - Salary and Education The scatterplot shows data on...Ch. 4 - Sisters and Brothers The scatterplot shows the...Ch. 4 - House Price and Area Describe the trend in the...Ch. 4 - Work and TV The scatterplot shows the number of...Ch. 4 - Work and Sleep The scatterplot shows the number of...
Ch. 4 - Age and Sleep The scatterplot shows the age and...Ch. 4 - Height and Weight for Women The figure shows a...Ch. 4 - College Tuition and ACT a. The first scatterplot...Ch. 4 - Ages of Women Who Give Birth The figure shows a...Ch. 4 - Law School The scatterplot shows the LSAT (Law...Ch. 4 - Medical School The scatterplot shows the...Ch. 4 - Matching Pick the letter of the graph that goes...Ch. 4 - Matching Pick the letter of the graph that goes...Ch. 4 - Matching Match each of the following correlations...Ch. 4 - Matching Match each of the following correlations...Ch. 4 - Airline Tickets (Example 2) The distance (in...Ch. 4 - Train Tickets The table for part (a) shows...Ch. 4 - SAT and GPA In Exercise 4.1 there is a graph of...Ch. 4 - House Price The correlation between house price...Ch. 4 - Rate My Professor Seth Wagerman, a former...Ch. 4 - Cousins Five people were asked how many female...Ch. 4 - GPA and Gym Use USA Today College published an...Ch. 4 - Education and Life Expectancy United Press...Ch. 4 - Salaries of College Graduates (Example 3) The...Ch. 4 - Mother and Daughter Heights The graph shows the...Ch. 4 - Median Weekly Earning by Gender The scatterplot...Ch. 4 - Home Prices and Size The scatterplot shows the...Ch. 4 - Height and Arm Span for Women (Example 4) TI-84...Ch. 4 - Hand and Foot Length for Women The computer output...Ch. 4 - Height and Arm Span for Men (Example 5)...Ch. 4 - Hand Length and Foot Length for Men Measurements...Ch. 4 - Comparing Correlation for Arm Span and Height The...Ch. 4 - Age and Weight for Men and Women The scatterplot...Ch. 4 - Singles and Doubles Winning Percentage The...Ch. 4 - Seesaw The figure shows a scatterplot of the...Ch. 4 - Choosing the Predictor and Response Variables...Ch. 4 - Choosing the Predictor and the Response Variable...Ch. 4 - Percentage of Smoke-Free Homes and Percentage of...Ch. 4 - Effect of Adult Smoking on High School Student...Ch. 4 - Car Insurance and Age The following graph shows...Ch. 4 - Life Insurance and Age The graph shows the monthly...Ch. 4 - How Is the Time of a Flight Related to the...Ch. 4 - Distance and Train Ticket Price The following...Ch. 4 - Do States with Higher Populations Have More...Ch. 4 - Movie Ratings The following table give the Rotten...Ch. 4 - Pitchers The table shows the Earned Run Average...Ch. 4 - Text Messages The following table shows the number...Ch. 4 - Answer the questions using complete sentences. a....Ch. 4 - Answer the questions using complete sentences. a....Ch. 4 - If there is a positive correlation between number...Ch. 4 - Suppose that the growth rate of children looks...Ch. 4 - Coefficient of Determination If the correlation...Ch. 4 - Coefficient of Determination Does a correlation of...Ch. 4 - Investing Some investors use a technique called...Ch. 4 - Blood Pressure Suppose a doctor telephones those...Ch. 4 - Salary and Year of Employment (Example 8) The...Ch. 4 - MPG: Highway and City The following figure shows...Ch. 4 - Cost of Turkeys The following table shows the...Ch. 4 - Wine Calories The table shows the calories in a...Ch. 4 - Teacher Pay and Expenditure Per Student (Example...Ch. 4 - Teacher Pay and High School Graduation Rates The...Ch. 4 - Does Having a Job Affect Students’ Grades?...Ch. 4 - Weight of Trash and Household Size Data were...Ch. 4 - Predicting Home Runs Data on the number of home...Ch. 4 - Predicting 3-Point Baskets Data on the 3-point...Ch. 4 - 4th-Grade Reading and Math Scores Data from the...Ch. 4 - SAT Scores The following table shows the average...Ch. 4 - Test Scores Assume that in a political science...Ch. 4 - Test Scores Assume that in a sociology class, the...Ch. 4 - Heights and Weights of People The following table...Ch. 4 - Heights and Weights of Men The table shows the...Ch. 4 - Prob. 77CRECh. 4 - Granola Bars The following table shows the fat...Ch. 4 - Shoe Size and Height The scatterplot shows the...Ch. 4 - Age and Sleep The following scatterplot shows the...Ch. 4 - Age and Weight The following scatterplot shows the...Ch. 4 - Heights and Test Scores a. The following figure...Ch. 4 - Law School Selectivity and Employment The...Ch. 4 - Prob. 84CRECh. 4 - Prob. 87CRECh. 4 - Fuel-Efficient Cars The following table gives the...Ch. 4 - Tall Buildings The following scatterplot shows...Ch. 4 - For 4.91 through 4.94 show your points in a rough...Ch. 4 - For 4.91 through 4.94 show your points in a rough...Ch. 4 - For 4.91 through 4.94 show your points in a rough...Ch. 4 - For 4.91 through 4.94 show your points in a rough...Ch. 4 - The following figure shows a scatterplot of the...Ch. 4 - Wages and Education The figure shows a scatterplot...Ch. 4 - Do Students Taking More Units Study More Hours?...Ch. 4 - Hours of Exercise and Hours of Homework The...Ch. 4 - Children’s Ages and Heights The following figure...Ch. 4 - Blackjack Tips The following figure shows the...Ch. 4 - Decrease in Cholesterol A doctor is studying...Ch. 4 - Prob. 102CRE
Additional Math Textbook Solutions
Find more solutions based on key concepts
23. A plant nursery sells two sizes of oak trees to landscapers. Large trees cost the nursery $120 from the gro...
College Algebra (Collegiate Math)
Students in a Listening Responses class bought 40 tickets for a piano concert. The number of tickets purchased ...
Elementary and Intermediate Algebra: Concepts and Applications (7th Edition)
1. How is a sample related to a population?
Elementary Statistics: Picturing the World (7th Edition)
Provide an example of a qualitative variable and an example of a quantitative variable.
Elementary Statistics ( 3rd International Edition ) Isbn:9781260092561
NOTE: Write your answers using interval notation when appropriate.
CHECKING ANALYTIC SKILLS Fill in each blank ...
Graphical Approach To College Algebra
Find E(X) for each of the distributions given in Exercise 2.1-3.
Probability And Statistical Inference (10th Edition)
Knowledge Booster


Learn more about
Need a deep-dive on the concept behind this application? Look no further. Learn more about this topic, statistics and related others by exploring similar questions and additional content below.Similar questions
- solve this on paperarrow_forwardApply STATA commands & submit the output for each question only when indicated below i. Apply the command egen to create a variable called "wyd" which is the rowtotal function on variables bwght & faminc. ii. Apply the list command for the first 10 observations to show that the code in part i worked. Include the outcome of this code iii. Apply the egen command to create a new variable called "bwghtsum" using the sum function on variable bwght by the variable high_faminc (Note: need to apply the bysort' statement) iv. Apply the "by high_faminc" statement to find the V. descriptive statistics of bwght and bwghtsum Include the output of this code. Why is there a difference between the standard deviations of bwght and bwghtsum from part iv of this question?arrow_forwardAccording to a health information website, the distribution of adults’ diastolic blood pressure (in millimeters of mercury, mmHg) can be modeled by a normal distribution with mean 70 mmHg and standard deviation 20 mmHg. b. Above what diastolic pressure would classify someone in the highest 1% of blood pressures? Show all calculations used.arrow_forward
- Write STATA codes which will generate the outcomes in the questions & submit the output for each question only when indicated below i. ii. iii. iv. V. Write a code which will allow STATA to go to your favorite folder to access your files. Load the birthweight1.dta dataset from your favorite folder and save it under a different filename to protect data integrity. Call the new dataset babywt.dta (make sure to use the replace option). Verify that it contains 2,998 observations and 8 variables. Include the output of this code. Are there missing observations for variable(s) for the variables called bwght, faminc, cigs? How would you know? (You may use more than one code to show your answer(s)) Include the output of your code (s). Write the definitions of these variables: bwght, faminc, male, white, motheduc,cigs; which of these variables are categorical? [Hint: use the labels of the variables & the browse command] Who is this dataset about? Who can use this dataset to answer what kind of…arrow_forwardApply STATA commands & submit the output for each question only when indicated below İ. ii. iii. iv. V. Apply the command summarize on variables bwght and faminc. What is the average birthweight of babies and family income of the respondents? Include the output of this code. Apply the tab command on the variable called male. How many of the babies and what share of babies are male? Include the output of this code. Find the summary statistics (i.e. use the sum command) of the variables bwght and faminc if the babies are white. Include the output of this code. Find the summary statistics (i.e. use the sum command) of the variables bwght and faminc if the babies are male but not white. Include the output of this code. Using your answers to previous subparts of this question: What is the difference between the average birthweight of a baby who is male and a baby who is male but not white? What can you say anything about the difference in family income of the babies that are male and male…arrow_forwardA public health researcher is studying the impacts of nudge marketing techniques on shoppers vegetablesarrow_forward
- The director of admissions at Kinzua University in Nova Scotia estimated the distribution of student admissions for the fall semester on the basis of past experience. Admissions Probability 1,100 0.5 1,400 0.4 1,300 0.1 Click here for the Excel Data File Required: What is the expected number of admissions for the fall semester? Compute the variance and the standard deviation of the number of admissions. Note: Round your standard deviation to 2 decimal places.arrow_forwardA pollster randomly selected four of 10 available people. Required: How many different groups of 4 are possible? What is the probability that a person is a member of a group? Note: Round your answer to 3 decimal places.arrow_forwardWind Mountain is an archaeological study area located in southwestern New Mexico. Potsherds are broken pieces of prehistoric Native American clay vessels. One type of painted ceramic vessel is called Mimbres classic black-on-white. At three different sites the number of such sherds was counted in local dwelling excavations. Test given. Site I Site II Site III 63 19 60 43 34 21 23 49 51 48 11 15 16 46 26 20 31 Find .arrow_forward
- Rothamsted Experimental Station (England) has studied wheat production since 1852. Each year many small plots of equal size but different soil/fertilizer conditions are planted with wheat. At the end of the growing season, the yield (in pounds) of the wheat on the plot is measured. Suppose for a random sample of years, one plot gave the following annual wheat production (in pounds): 4.46 4.21 4.40 4.81 2.81 2.90 4.93 3.54 4.16 4.48 3.26 4.74 4.97 4.02 4.91 2.59 Use a calculator to verify that the sample variance for this plot is . Another random sample of years for a second plot gave the following annual wheat production (in pounds): 3.89 3.81 3.95 4.07 4.01 3.73 4.02 3.78 3.72 3.96 3.62 3.76 4.02 3.73 3.94 4.03 Use a calculator to verify that the sample variance for this plot is . Suppose that we test the claim using that the population variance of annual wheat production for the first plot is larger…arrow_forwardIt is thought that prehistoric Native Americans did not take their best tools, pottery, and household items when they visited higher elevations for their summer camps. It is hypothesized that archaeological sites tend to lose their cultural identity and specific cultural affiliation as the elevation of the site increases. Let x be the elevation (in thousands of feet) for an archaeological site in the southwestern United States. Let y be the percentage of unidentified artifacts (no specific cultural affiliation) at a given elevation. Suppose that the following data were obtained for a collection of archaeological sites in New Mexico: x 5.50 6.00 6.75 7.00 7.75 y 37 38 92 70 99 Find the equation of the least squares line . Round a and b to three decimal places.arrow_forwardA fitness trainer wants to estimate the effect of fitness activities on muscle mass for different weight categories of club members. They choose the most popular fitness classes at the gym: yoga, circuit training, and high-intensity interval training (HIIT). Suppose that the weights of club members are separated into three levels: under 155 pounds, 155 – 200 pounds, and over 200 pounds. Draw a flow chart showing the design of this experiment.arrow_forward
arrow_back_ios
SEE MORE QUESTIONS
arrow_forward_ios
Recommended textbooks for you
 Big Ideas Math A Bridge To Success Algebra 1: Stu...AlgebraISBN:9781680331141Author:HOUGHTON MIFFLIN HARCOURTPublisher:Houghton Mifflin Harcourt
 Glencoe Algebra 1, Student Edition, 9780079039897...AlgebraISBN:9780079039897Author:CarterPublisher:McGraw Hill
 Holt Mcdougal Larson Pre-algebra: Student Edition...AlgebraISBN:9780547587776Author:HOLT MCDOUGALPublisher:HOLT MCDOUGAL
Big Ideas Math A Bridge To Success Algebra 1: Stu...
Algebra
ISBN:9781680331141
Author:HOUGHTON MIFFLIN HARCOURT
Publisher:Houghton Mifflin Harcourt
Glencoe Algebra 1, Student Edition, 9780079039897...
Algebra
ISBN:9780079039897
Author:Carter
Publisher:McGraw Hill
Holt Mcdougal Larson Pre-algebra: Student Edition...
Algebra
ISBN:9780547587776
Author:HOLT MCDOUGAL
Publisher:HOLT MCDOUGAL
Which is the best chart: Selecting among 14 types of charts Part II; Author: 365 Data Science;https://www.youtube.com/watch?v=qGaIB-bRn-A;License: Standard YouTube License, CC-BY