Concept explainers
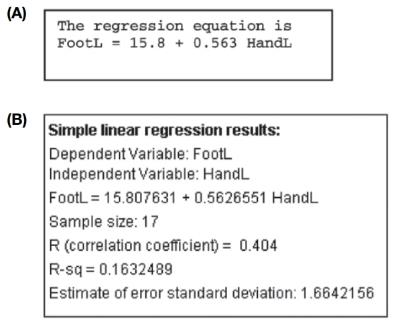
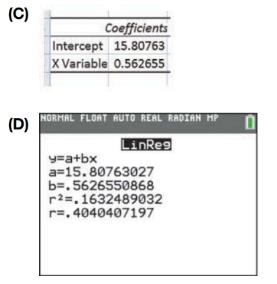
Hand Length and Foot Length for Men Measurements were made for a sample of adult men. Assume that the association between their hand length and foot length is linear. Output for predicting foot length from hand length is provided from several different statistical technologies.
a. Report the equation for predicting foot length from hand length. Use the variable names FootL and HandL in the equation, rather than
b. Report the slope and the intercept from each technology, using all the digits given.


Want to see the full answer?
Check out a sample textbook solution
Chapter 4 Solutions
INTRODUCTORY STATISTICS (LOOSELEAF)
Additional Math Textbook Solutions
Math in Our World
College Algebra (7th Edition)
Elementary Statistics ( 3rd International Edition ) Isbn:9781260092561
Elementary and Intermediate Algebra: Concepts and Applications (7th Edition)
Precalculus: A Unit Circle Approach (3rd Edition)
Elementary Statistics: Picturing the World (7th Edition)
- (b) Define a simple random variable. Provide an example.arrow_forward17. (a) Define the distribution of a random variable X. (b) Define the distribution function of a random variable X. (c) State the properties of a distribution function. (d) Explain the difference between the distribution and the distribution function of X.arrow_forward16. (a) Show that IA(w) is a random variable if and only if A E Farrow_forward
- 15. Let 2 {1, 2,..., 6} and Fo({1, 2, 3, 4), (3, 4, 5, 6}). (a) Is the function X (w) = 21(3, 4) (w)+711.2,5,6) (w) a random variable? Explain. (b) Provide a function from 2 to R that is not a random variable with respect to (N, F). (c) Write the distribution of X. (d) Write and plot the distribution function of X.arrow_forward20. Define the o-field R2. Explain its relation to the o-field R.arrow_forward7. Show that An → A as n→∞ I{An} - → I{A} as n→ ∞.arrow_forward
- 7. (a) Show that if A,, is an increasing sequence of measurable sets with limit A = Un An, then P(A) is an increasing sequence converging to P(A). (b) Repeat the same for a decreasing sequence. (c) Show that the following inequalities hold: P (lim inf An) lim inf P(A) ≤ lim sup P(A) ≤ P(lim sup A). (d) Using the above inequalities, show that if A, A, then P(A) + P(A).arrow_forward19. (a) Define the joint distribution and joint distribution function of a bivariate ran- dom variable. (b) Define its marginal distributions and marginal distribution functions. (c) Explain how to compute the marginal distribution functions from the joint distribution function.arrow_forward18. Define a bivariate random variable. Provide an example.arrow_forward
- 6. (a) Let (, F, P) be a probability space. Explain when a subset of ?? is measurable and why. (b) Define a probability measure. (c) Using the probability axioms, show that if AC B, then P(A) < P(B). (d) Show that P(AUB) + P(A) + P(B) in general. Write down and prove the formula for the probability of the union of two sets.arrow_forward21. Prove that: {(a, b), - sa≤barrow_forward10. (a) Define the independence of sets A, B, C. (b) Provide an example where A, B, C are pairwise independent but not mutually independent. (c) Give an example where P(AnBnC) = P(A)P(B)P(C), but the sets are not pairwise independent.arrow_forwardarrow_back_iosSEE MORE QUESTIONSarrow_forward_ios
 Glencoe Algebra 1, Student Edition, 9780079039897...AlgebraISBN:9780079039897Author:CarterPublisher:McGraw Hill
 Holt Mcdougal Larson Pre-algebra: Student Edition...AlgebraISBN:9780547587776Author:HOLT MCDOUGALPublisher:HOLT MCDOUGAL
 Elementary AlgebraAlgebraISBN:9780998625713Author:Lynn Marecek, MaryAnne Anthony-SmithPublisher:OpenStax - Rice University
 College Algebra (MindTap Course List)AlgebraISBN:9781305652231Author:R. David Gustafson, Jeff HughesPublisher:Cengage Learning


