
Introduction to Statistical Quality Control
7th Edition
ISBN: 9781118146811
Author: Montgomery, Douglas C.
Publisher: John Wiley & Sons Inc
expand_more
expand_more
format_list_bulleted
Concept explainers
Videos
Textbook Question
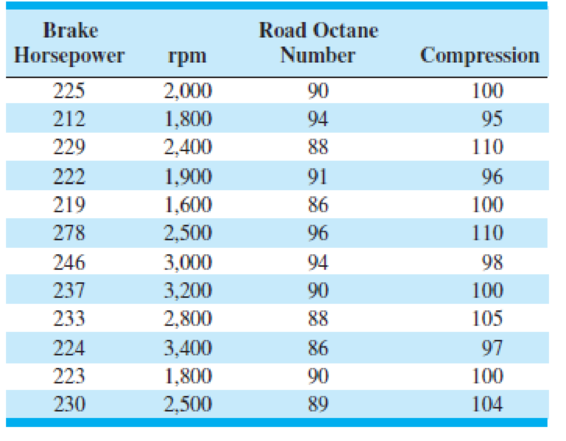
Chapter 4, Problem 47E
The brake horsepower developed by an automobile engine on a dynamometer is thought to be a
- (a) Fit a multiple regression model to these data.
- (b) Test for significance of regression. What conclusions can you draw?
- (c) Based on t-tests, do you need all three regressor variables in the model?
TABLE 4E.10
Automobile Engine Data for Exercise 4.47
Expert Solution & Answer
Want to see the full answer?
Check out a sample textbook solution
Students have asked these similar questions
NC Current Students - North Ce X | NC Canvas Login Links - North ( X
Final Exam Comprehensive x Cengage Learning
x
WASTAT - Final Exam - STAT
→
C
webassign.net/web/Student/Assignment-Responses/submit?dep=36055360&tags=autosave#question3659890_9
Part (b)
Draw a scatter plot of the ordered pairs.
N
Life
Expectancy
Life
Expectancy
80
70
600
50
40
30
20
10
Year of
1950
1970 1990
2010 Birth
O
Life
Expectancy
Part (c)
800
70
60
50
40
30
20
10
1950
1970 1990
W
ALT
林
$
#
4
R
J7
Year of
2010 Birth
F6
4+
80
70
60
50
40
30
20
10
Year of
1950 1970 1990
2010 Birth
Life
Expectancy
Ox
800
70
60
50
40
30
20
10
Year of
1950 1970 1990 2010 Birth
hp
P.B.
KA
&
7
80
% 5
H
A
B
F10
711
N
M
K
744
PRT SC
ALT
CTRL
Harvard University
California Institute of Technology
Massachusetts Institute of Technology
Stanford University
Princeton University
University of Cambridge
University of Oxford
University of California, Berkeley
Imperial College London
Yale University
University of California, Los Angeles
University of Chicago
Johns Hopkins University
Cornell University
ETH Zurich
University of Michigan
University of Toronto
Columbia University
University of Pennsylvania
Carnegie Mellon University
University of Hong Kong
University College London
University of Washington
Duke University
Northwestern University
University of Tokyo
Georgia Institute of Technology
Pohang University of Science and Technology
University of California, Santa Barbara
University of British Columbia
University of North Carolina at Chapel Hill
University of California, San Diego
University of Illinois at Urbana-Champaign
National University of Singapore
McGill…
Name
Harvard University
California Institute of Technology
Massachusetts Institute of Technology
Stanford University
Princeton University
University of Cambridge
University of Oxford
University of California, Berkeley
Imperial College London
Yale University
University of California, Los Angeles
University of Chicago
Johns Hopkins University
Cornell University
ETH Zurich
University of Michigan
University of Toronto
Columbia University
University of Pennsylvania
Carnegie Mellon University
University of Hong Kong
University College London
University of Washington
Duke University
Northwestern University
University of Tokyo
Georgia Institute of Technology
Pohang University of Science and Technology
University of California, Santa Barbara
University of British Columbia
University of North Carolina at Chapel Hill
University of California, San Diego
University of Illinois at Urbana-Champaign
National University of Singapore…
Chapter 4 Solutions
Introduction to Statistical Quality Control
Ch. 4 - Suppose that you are testing the following...Ch. 4 - Suppose that you are testing the following...Ch. 4 - Suppose that you are testing the following...Ch. 4 - Suppose that you are testing the following...Ch. 4 - Suppose that you are testing the following...Ch. 4 - Suppose that you are testing the following...Ch. 4 - The inside diameters of bearings used in an...Ch. 4 - The tensile strength of a fiber used in...Ch. 4 - The service life of a battery used in a cardiac...Ch. 4 - Using the data from Exercise 4.7, construct a 95%...
Ch. 4 - A new process has been developed for applying...Ch. 4 - A machine is used to fill containers with a liquid...Ch. 4 - Ferric chloride is used as a flux in some types of...Ch. 4 - The diameters of aluminum alloy rods produced on...Ch. 4 - The output voltage of a power supply is assumed to...Ch. 4 - Two machines are used for filling glass bottles...Ch. 4 - Two quality control technicians measured the...Ch. 4 - Suppose that x1N(,12) and x2N(2,22), and that x1...Ch. 4 - Two different hardening processes(1) saltwater...Ch. 4 - A random sample of 200 printed circuit boards...Ch. 4 - A random sample of 500 connecting rod pins...Ch. 4 - Two processes are used to produce forgings used in...Ch. 4 - A new purification unit is installed in a chemical...Ch. 4 - Two different types of glass bottles are suitable...Ch. 4 - The diameter of a metal rod is measured by 12...Ch. 4 - The cooling system in a nuclear submarine consists...Ch. 4 - An experiment was conducted to investigate the...Ch. 4 - Suppose we wish to test the hypotheses H0:=15H1:15...Ch. 4 - Consider the hypotheses H0:=0H1:0 where 2 is...Ch. 4 - Sample size allocation. Suppose we are testing the...Ch. 4 - Develop a test for the hypotheses H0: 1 = 2 H1: 1 ...Ch. 4 - Nonconformities occur in glass bottles according...Ch. 4 - An inspector counts the surface-finish defects in...Ch. 4 - An in-line tester is used to evaluate the...Ch. 4 - An article in Solid State Technology (May 1987)...Ch. 4 - Compare the mean etch uniformity values at each of...Ch. 4 - An article in the ACI Materials Journal (Vol. 84,...Ch. 4 - Compare the mean compressive strength at each...Ch. 4 - An aluminum producer manufactures carbon anodes...Ch. 4 - Plot the residuals from Exercise 4.36 against the...Ch. 4 - An article in Environmental International (Vol....Ch. 4 - An article in the Journal of the Electrochemical...Ch. 4 - The tensile strength of a paper product is related...Ch. 4 - A plant distills liquid air to produce oxygen,...Ch. 4 - Plot the residuals from Exercise 4.43 and comment...Ch. 4 - Plot the residuals from Exercise 4.44 and comment...Ch. 4 - The brake horsepower developed by an automobile...Ch. 4 - Analyze the residuals from the regression model in...Ch. 4 - Table 4E.11 contains the data from a patient...Ch. 4 - Analyze the residuals from the regression model on...Ch. 4 - Reconsider the patient satisfaction data in Table...Ch. 4 - Analyze the residuals from the multiple regression...Ch. 4 - Consider the Minitab output below. (a) Fill in the...Ch. 4 - Suppose that you are testing H0: 1 = 2 versus H1: ...Ch. 4 - Suppose that you are testing H0: = 2 versus H1: ...Ch. 4 - Consider the Minitab output below. (a) Fill in the...Ch. 4 - Consider the Minitab output shown below. (a) Is...Ch. 4 - Consider the Minitab output shown below. (a) Fill...Ch. 4 - Consider the Minitab output below. (a) Fill in the...Ch. 4 - Consider a one-way or single-factor ANOVA with...Ch. 4 - Consider the Minitab ANOVA output below. Fill in...
Additional Math Textbook Solutions
Find more solutions based on key concepts
A categorical variable has three categories, with the following frequencies of occurrence: a. Compute the perce...
Basic Business Statistics, Student Value Edition
56. Power Voting and Coalitions. Use the Web investigate the political coalitions at the national level in a pa...
Using and Understanding Mathematics: A Quantitative Reasoning Approach (6th Edition)
The equivalent expression of x(y+z) by using the commutative property.
Calculus for Business, Economics, Life Sciences, and Social Sciences (14th Edition)
In Exercises 7–18, use the method in Example 3 to find (a) the slope of the curve at the given point P, and (b)...
University Calculus: Early Transcendentals (4th Edition)
Knowledge Booster


Learn more about
Need a deep-dive on the concept behind this application? Look no further. Learn more about this topic, statistics and related others by exploring similar questions and additional content below.Similar questions
- A company found that the daily sales revenue of its flagship product follows a normal distribution with a mean of $4500 and a standard deviation of $450. The company defines a "high-sales day" that is, any day with sales exceeding $4800. please provide a step by step on how to get the answers in excel Q: What percentage of days can the company expect to have "high-sales days" or sales greater than $4800? Q: What is the sales revenue threshold for the bottom 10% of days? (please note that 10% refers to the probability/area under bell curve towards the lower tail of bell curve) Provide answers in the yellow cellsarrow_forwardFind the critical value for a left-tailed test using the F distribution with a 0.025, degrees of freedom in the numerator=12, and degrees of freedom in the denominator = 50. A portion of the table of critical values of the F-distribution is provided. Click the icon to view the partial table of critical values of the F-distribution. What is the critical value? (Round to two decimal places as needed.)arrow_forwardA retail store manager claims that the average daily sales of the store are $1,500. You aim to test whether the actual average daily sales differ significantly from this claimed value. You can provide your answer by inserting a text box and the answer must include: Null hypothesis, Alternative hypothesis, Show answer (output table/summary table), and Conclusion based on the P value. Showing the calculation is a must. If calculation is missing,so please provide a step by step on the answers Numerical answers in the yellow cellsarrow_forward
arrow_back_ios
SEE MORE QUESTIONS
arrow_forward_ios
Recommended textbooks for you
 Functions and Change: A Modeling Approach to Coll...AlgebraISBN:9781337111348Author:Bruce Crauder, Benny Evans, Alan NoellPublisher:Cengage Learning
 Glencoe Algebra 1, Student Edition, 9780079039897...AlgebraISBN:9780079039897Author:CarterPublisher:McGraw Hill
 College AlgebraAlgebraISBN:9781305115545Author:James Stewart, Lothar Redlin, Saleem WatsonPublisher:Cengage Learning
 Algebra & Trigonometry with Analytic GeometryAlgebraISBN:9781133382119Author:SwokowskiPublisher:Cengage
 Big Ideas Math A Bridge To Success Algebra 1: Stu...AlgebraISBN:9781680331141Author:HOUGHTON MIFFLIN HARCOURTPublisher:Houghton Mifflin Harcourt
Functions and Change: A Modeling Approach to Coll...
Algebra
ISBN:9781337111348
Author:Bruce Crauder, Benny Evans, Alan Noell
Publisher:Cengage Learning
Glencoe Algebra 1, Student Edition, 9780079039897...
Algebra
ISBN:9780079039897
Author:Carter
Publisher:McGraw Hill
College Algebra
Algebra
ISBN:9781305115545
Author:James Stewart, Lothar Redlin, Saleem Watson
Publisher:Cengage Learning
Algebra & Trigonometry with Analytic Geometry
Algebra
ISBN:9781133382119
Author:Swokowski
Publisher:Cengage
Big Ideas Math A Bridge To Success Algebra 1: Stu...
Algebra
ISBN:9781680331141
Author:HOUGHTON MIFFLIN HARCOURT
Publisher:Houghton Mifflin Harcourt
Correlation Vs Regression: Difference Between them with definition & Comparison Chart; Author: Key Differences;https://www.youtube.com/watch?v=Ou2QGSJVd0U;License: Standard YouTube License, CC-BY
Correlation and Regression: Concepts with Illustrative examples; Author: LEARN & APPLY : Lean and Six Sigma;https://www.youtube.com/watch?v=xTpHD5WLuoA;License: Standard YouTube License, CC-BY