
Connect Hosted by ALEKS Online Access for Elementary Statistics
3rd Edition
ISBN: 9781260373769
Author: William Navidi
Publisher: MCGRAW-HILL HIGHER EDUCATION
expand_more
expand_more
format_list_bulleted
Concept explainers
Videos
Textbook Question
Chapter 4, Problem 3RE
How’s your mileage? Weight (in tons) and fuel economy (in mpg) were measured for a sample of seven diesel trucks. The results are presented in the following table.
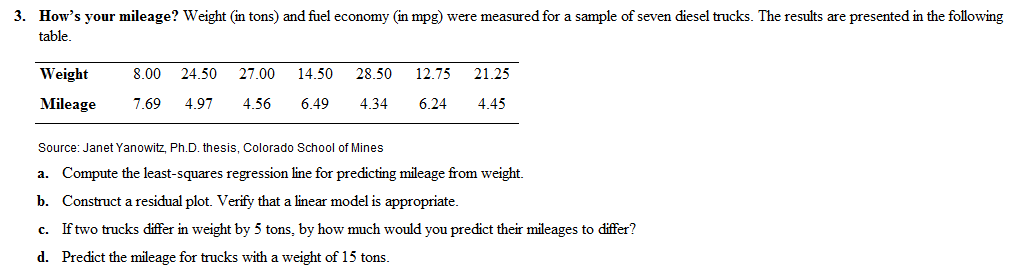
- Compute the least-squares regression he for predicting mileage from weight.
- Construct a residual plot. Verify that a linear model is appropriate.
- If two tucks differ in weight by 5 tons, by how much would you predict their mileages to differ?
- Predict the mileage for trucks with a weight of 15 tons.
Expert Solution & Answer
Want to see the full answer?
Check out a sample textbook solution
Students have asked these similar questions
A 24-1 design has been used to investigate the effect of four factors on the resistivity of a silicon wafer. The data
from this experiment are shown in Table 4.
Table 4: Resistivity Experiment for Exercise 5
Run
A
B
с
D
Resistivity
1
23
2
3
4
5
6
7
8
9
10
11
12
I+I+I+I+Oooo
0
0
||++TI++o000
33.2
4.6
31.2
9.6
40.6
162.4
39.4
158.6
63.4
62.6
58.7
0
0
60.9
3
(a) Estimate the factor effects. Plot the effect estimates on a normal probability scale.
(b) Identify a tentative model for this process. Fit the model and test for curvature.
(c) Plot the residuals from the model in part (b) versus the predicted resistivity. Is there any indication on
this plot of model inadequacy?
(d) Construct a normal probability plot of the residuals. Is there any reason to doubt the validity of the
normality assumption?
Stem1: 1,4
Stem 2: 2,4,8
Stem3: 2,4
Stem4: 0,1,6,8
Stem5: 0,1,2,3,9
Stem 6: 2,2
What’s the Min,Q1, Med,Q3,Max?
Are the t-statistics here greater than 1.96? What do you conclude?
colgPA= 1.39+0.412 hsGPA
(.33) (0.094)
Find the P value
Chapter 4 Solutions
Connect Hosted by ALEKS Online Access for Elementary Statistics
Ch. 4.1 - In Exercises 9-12, fill in each blank with the...Ch. 4.1 - In Exercises 9-12, fill in each blank with the...Ch. 4.1 - In Exercises 9-12, fill in each blank with the...Ch. 4.1 - In Exercises 9-12, fill in each blank with the...Ch. 4.1 - Prob. 13ECh. 4.1 - Prob. 14ECh. 4.1 - In Exercises 13-16, determine whether the...Ch. 4.1 - In Exercises 13-16, determine whether the...Ch. 4.1 - In Exercises 17-20, compute the correlation...Ch. 4.1 - In Exercises 17-20, compute the correlation...
Ch. 4.1 - In Exercises 17-20, compute the correlation...Ch. 4.1 - In Exercises 17-20, compute the correlation...Ch. 4.1 - In Exercises 21-24, determine whether the...Ch. 4.1 - In Exercises 21-24, determine whether the...Ch. 4.1 - In Exercises 21-24, determine whether the...Ch. 4.1 - In Exercises 21-24, determine whether the...Ch. 4.1 - In Exercises 25-30, determine whether the...Ch. 4.1 - In Exercises 25-30, determine whether the...Ch. 4.1 - In Exercises 25-30, determine whether the...Ch. 4.1 - In Exercises 25-30, determine whether the...Ch. 4.1 - In Exercises 25-30, determine whether the...Ch. 4.1 - In Exercises 25-30, determine whether the...Ch. 4.1 - Price of eggs and milk: The following table...Ch. 4.1 - Government funding: The following table presents...Ch. 4.1 - Pass the ball: The following table lists the...Ch. 4.1 - Carbon footprint: Carbon dioxide (CO2) is produced...Ch. 4.1 - Foot temperatures: Foot ulcers are a common...Ch. 4.1 - Mortgage payments: The following table presents...Ch. 4.1 - Blood pressure: A blood pressure measurement...Ch. 4.1 - Prob. 38ECh. 4.1 - Police and crime: In a survey of cities in the...Ch. 4.1 - Age and education: A survey of U.S. adults showed...Ch. 4.1 - Whats the correlation? In a sample of adults, the...Ch. 4.1 - Prob. 42ECh. 4.1 - Changing means and standard deviations: A small...Ch. 4.2 - In Exercises 5-7, fill in each blank with the...Ch. 4.2 - In Exercises 5-7, fill in each blank with the...Ch. 4.2 - In Exercises 5-7, fill in each blank with the...Ch. 4.2 - Prob. 8ECh. 4.2 - Prob. 9ECh. 4.2 - Prob. 10ECh. 4.2 - Prob. 11ECh. 4.2 - Prob. 12ECh. 4.2 - In Exercises 13-16, compute the least-squares...Ch. 4.2 - In Exercises 13-16, compute the least-squares...Ch. 4.2 - In Exercises 13-16, compute the least-squares...Ch. 4.2 - In Exercises 13-16, compute the least-squares...Ch. 4.2 - Compute the least-squares regression he for...Ch. 4.2 - Compute the least-squares regression he for...Ch. 4.2 - In a hypothetical study of the relationship...Ch. 4.2 - Assume in a study of educational level in years...Ch. 4.2 - Price of eggs and milk: The following table...Ch. 4.2 - Government funding: The following table presents...Ch. 4.2 - Pass the ball: The following table lists the...Ch. 4.2 - Carbon footprint: Carbon dioxide (CO2) is produced...Ch. 4.2 - Foot temperatures: Foot ulcers are a common...Ch. 4.2 - Mortgage payments: The following table presents...Ch. 4.2 - Blood pressure: A blood pressure measurement...Ch. 4.2 - Butterfly wings: Do larger butterflies live...Ch. 4.2 - Interpreting technology: The following display...Ch. 4.2 - Interpreting technology: The following display...Ch. 4.2 - Interpreting technology: The following MINITAB...Ch. 4.2 - Interpreting technology: The following MINITAB...Ch. 4.2 - Prob. 33ECh. 4.2 - Prob. 34ECh. 4.2 - Least-squares regression line for z-scores: The...Ch. 4.3 - In Exercises 5-10, fill in each blank with the...Ch. 4.3 - In Exercises 5-10, fill in each blank with the...Ch. 4.3 - In Exercises 5-10, fill in each blank with the...Ch. 4.3 - In Exercises 5-10, fill in each blank with the...Ch. 4.3 - In Exercises 5-10, fill in each blank with the...Ch. 4.3 - Prob. 10ECh. 4.3 - Prob. 11ECh. 4.3 - In Exercises 11-14, determine whether the...Ch. 4.3 - Prob. 13ECh. 4.3 - In Exercises 11-14, determine whether the...Ch. 4.3 - For the following data set: Compute the...Ch. 4.3 - For the following data set: Compute the...Ch. 4.3 - For the following data set: Compute the...Ch. 4.3 - For the following data set: Compute the...Ch. 4.3 - Prob. 19ECh. 4.3 - Prob. 20ECh. 4.3 - Prob. 21ECh. 4.3 - Prob. 22ECh. 4.3 - Hot enough for you? The following table presents...Ch. 4.3 - Presidents and first ladies: The presents the ages...Ch. 4.3 - Mutant genes: In a study to determine whether the...Ch. 4.3 - Imports and exports: The following table presents...Ch. 4.3 - Energy consumption: The following table presents...Ch. 4.3 - Cost of health care: The following table presents...Ch. 4.3 - Prob. 29ECh. 4.3 - Prob. 30ECh. 4.3 - Prob. 31ECh. 4.3 - Transforming a variable: The following table...Ch. 4.3 - Prob. 33ECh. 4.3 - Prob. 34ECh. 4 - Compute the correlation coefficient for the...Ch. 4 - The number of theaters showing the movie Monsters...Ch. 4 - Use the data in Exercise 2 to compute the...Ch. 4 - A scatterplot has a correlation of r=1. Describe...Ch. 4 - Prob. 5CQCh. 4 - Prob. 6CQCh. 4 - Use the least-squares regression line computed in...Ch. 4 - Use the least-squares regression line computed in...Ch. 4 - Prob. 9CQCh. 4 - A scatterplot has a least-squares regression line...Ch. 4 - Prob. 11CQCh. 4 - Prob. 12CQCh. 4 - A sample of students was studied to determine the...Ch. 4 - In a scatter-plot; the point (-2, 7) is...Ch. 4 - The correlation coefficient for a data set is...Ch. 4 - Prob. 1RECh. 4 - Prob. 2RECh. 4 - Hows your mileage? Weight (in tons) and fuel...Ch. 4 - Prob. 4RECh. 4 - Energy efficiency: A sample of 10 households was...Ch. 4 - Energy efficiency: Using the data in Exercise 5:...Ch. 4 - Prob. 7RECh. 4 - Prob. 8RECh. 4 - Prob. 9RECh. 4 - Prob. 10RECh. 4 - Baby weights: The average gestational age (time...Ch. 4 - Commute times: Every morning, Tania leaves for...Ch. 4 - Prob. 13RECh. 4 - Prob. 14RECh. 4 - Prob. 15RECh. 4 - Describe an example which two variables are...Ch. 4 - Two variables x and y have a positive association...Ch. 4 - Prob. 3WAICh. 4 - Prob. 4WAICh. 4 - Prob. 5WAICh. 4 - Prob. 6WAICh. 4 - Prob. 7WAICh. 4 - Prob. 8WAICh. 4 - Prob. 9WAICh. 4 - The following table, reproduced from the chapter...Ch. 4 - Prob. 2CSCh. 4 - Prob. 3CSCh. 4 - Prob. 4CSCh. 4 - Prob. 5CSCh. 4 - Prob. 6CSCh. 4 - Prob. 7CSCh. 4 - Prob. 8CSCh. 4 - Prob. 9CSCh. 4 - Prob. 10CSCh. 4 - Prob. 11CSCh. 4 - Prob. 12CSCh. 4 - Prob. 13CSCh. 4 - If we are going to use data from this year to...Ch. 4 - Prob. 15CS
Knowledge Booster


Learn more about
Need a deep-dive on the concept behind this application? Look no further. Learn more about this topic, statistics and related others by exploring similar questions and additional content below.Similar questions
- A poll before the elections showed that in a given sample 79% of people vote for candidate C. How many people should be interviewed so that the pollsters can be 99% sure that from 75% to 83% of the population will vote for candidate C? Round your answer to the whole number.arrow_forwardSuppose a random sample of 459 married couples found that 307 had two or more personality preferences in common. In another random sample of 471 married couples, it was found that only 31 had no preferences in common. Let p1 be the population proportion of all married couples who have two or more personality preferences in common. Let p2 be the population proportion of all married couples who have no personality preferences in common. Find a95% confidence interval for . Round your answer to three decimal places.arrow_forwardA history teacher interviewed a random sample of 80 students about their preferences in learning activities outside of school and whether they are considering watching a historical movie at the cinema. 69 answered that they would like to go to the cinema. Let p represent the proportion of students who want to watch a historical movie. Determine the maximal margin of error. Use α = 0.05. Round your answer to three decimal places. arrow_forward
- A random sample of medical files is used to estimate the proportion p of all people who have blood type B. If you have no preliminary estimate for p, how many medical files should you include in a random sample in order to be 99% sure that the point estimate will be within a distance of 0.07 from p? Round your answer to the next higher whole number.arrow_forwardA clinical study is designed to assess the average length of hospital stay of patients who underwent surgery. A preliminary study of a random sample of 70 surgery patients’ records showed that the standard deviation of the lengths of stay of all surgery patients is 7.5 days. How large should a sample to estimate the desired mean to within 1 day at 95% confidence? Round your answer to the whole number.arrow_forwardA clinical study is designed to assess the average length of hospital stay of patients who underwent surgery. A preliminary study of a random sample of 70 surgery patients’ records showed that the standard deviation of the lengths of stay of all surgery patients is 7.5 days. How large should a sample to estimate the desired mean to within 1 day at 95% confidence? Round your answer to the whole number.arrow_forward
- In the experiment a sample of subjects is drawn of people who have an elbow surgery. Each of the people included in the sample was interviewed about their health status and measurements were taken before and after surgery. Are the measurements before and after the operation independent or dependent samples?arrow_forwardiid 1. The CLT provides an approximate sampling distribution for the arithmetic average Ỹ of a random sample Y₁, . . ., Yn f(y). The parameters of the approximate sampling distribution depend on the mean and variance of the underlying random variables (i.e., the population mean and variance). The approximation can be written to emphasize this, using the expec- tation and variance of one of the random variables in the sample instead of the parameters μ, 02: YNEY, · (1 (EY,, varyi n For the following population distributions f, write the approximate distribution of the sample mean. (a) Exponential with rate ẞ: f(y) = ß exp{−ßy} 1 (b) Chi-square with degrees of freedom: f(y) = ( 4 ) 2 y = exp { — ½/ } г( (c) Poisson with rate λ: P(Y = y) = exp(-\} > y! y²arrow_forward2. Let Y₁,……., Y be a random sample with common mean μ and common variance σ². Use the CLT to write an expression approximating the CDF P(Ỹ ≤ x) in terms of µ, σ² and n, and the standard normal CDF Fz(·).arrow_forward
- matharrow_forwardCompute the median of the following data. 32, 41, 36, 42, 29, 30, 40, 22, 25, 37arrow_forwardTask Description: Read the following case study and answer the questions that follow. Ella is a 9-year-old third-grade student in an inclusive classroom. She has been diagnosed with Emotional and Behavioural Disorder (EBD). She has been struggling academically and socially due to challenges related to self-regulation, impulsivity, and emotional outbursts. Ella's behaviour includes frequent tantrums, defiance toward authority figures, and difficulty forming positive relationships with peers. Despite her challenges, Ella shows an interest in art and creative activities and demonstrates strong verbal skills when calm. Describe 2 strategies that could be implemented that could help Ella regulate her emotions in class (4 marks) Explain 2 strategies that could improve Ella’s social skills (4 marks) Identify 2 accommodations that could be implemented to support Ella academic progress and provide a rationale for your recommendation.(6 marks) Provide a detailed explanation of 2 ways…arrow_forward
arrow_back_ios
SEE MORE QUESTIONS
arrow_forward_ios
Recommended textbooks for you

 Functions and Change: A Modeling Approach to Coll...AlgebraISBN:9781337111348Author:Bruce Crauder, Benny Evans, Alan NoellPublisher:Cengage Learning
 Glencoe Algebra 1, Student Edition, 9780079039897...AlgebraISBN:9780079039897Author:CarterPublisher:McGraw Hill
 Big Ideas Math A Bridge To Success Algebra 1: Stu...AlgebraISBN:9781680331141Author:HOUGHTON MIFFLIN HARCOURTPublisher:Houghton Mifflin Harcourt
 College AlgebraAlgebraISBN:9781305115545Author:James Stewart, Lothar Redlin, Saleem WatsonPublisher:Cengage Learning
 Linear Algebra: A Modern IntroductionAlgebraISBN:9781285463247Author:David PoolePublisher:Cengage Learning
Functions and Change: A Modeling Approach to Coll...
Algebra
ISBN:9781337111348
Author:Bruce Crauder, Benny Evans, Alan Noell
Publisher:Cengage Learning
Glencoe Algebra 1, Student Edition, 9780079039897...
Algebra
ISBN:9780079039897
Author:Carter
Publisher:McGraw Hill
Big Ideas Math A Bridge To Success Algebra 1: Stu...
Algebra
ISBN:9781680331141
Author:HOUGHTON MIFFLIN HARCOURT
Publisher:Houghton Mifflin Harcourt
College Algebra
Algebra
ISBN:9781305115545
Author:James Stewart, Lothar Redlin, Saleem Watson
Publisher:Cengage Learning
Linear Algebra: A Modern Introduction
Algebra
ISBN:9781285463247
Author:David Poole
Publisher:Cengage Learning
Correlation Vs Regression: Difference Between them with definition & Comparison Chart; Author: Key Differences;https://www.youtube.com/watch?v=Ou2QGSJVd0U;License: Standard YouTube License, CC-BY
Correlation and Regression: Concepts with Illustrative examples; Author: LEARN & APPLY : Lean and Six Sigma;https://www.youtube.com/watch?v=xTpHD5WLuoA;License: Standard YouTube License, CC-BY